Debugging Attack Modules
The following sections provide information on how you can debug issues you may encounter with your attack modules.
Attaching Visual Studio to a running scan
Attack Module DLLs are loaded by the ScanEngine.exe process. To debug an Attack Module, Visual Studio should be attached to the ScanEngine.exe process after the scan is started and the code type should be set to ‘Managed (v4.0) code, Native code’ as shown on the picture below.
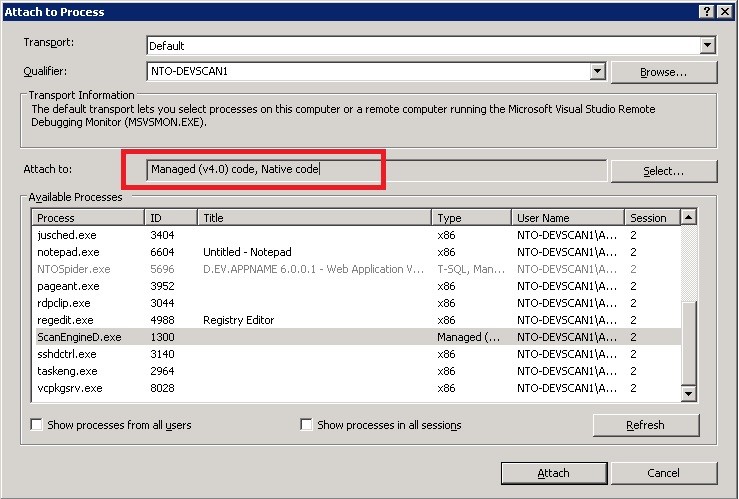
Note that there can be multiple ScanEngine.exe processes running at the same time. AppSpider creates one ScanEngine.exe process for every scan configuration that is being opened by the user. It is recommended to attach to all ScanEngine.exe processes and run only one scan during debugging.
As it was mentioned before, AppSpider runs attacks from multiple threads which makes it difficult to debug a module because multiple threads will be executing the code being debugged. To simplify debugging it is recommended to run the scan in single-threaded mode, which can be set in the scan configuration file. The XPath to this setting is /ScanConfig/PerformanceConfig/SingleThreadedScan — set to 1. It may also be set using the Advanced Options portion of the AppSpider GUI, if that is being used. See the AppSpider 6.2 User Guide for details on Advanced Options.
Starting a new scan from Visual Studio
In many cases, attaching to a running scan cannot solve all debugging needs. For instance, if you have multiple scans running, you may not know which ScanEngine to connect to. Also, because ScanEngine instances are created after scanning is started, you may not have enough time to attach the debugger in time to debug the relevant code. This section describes an alternative approach.
To debug attack modules using the installset, you will always need two processes: ScanEngine.exe (loads attack modules and performs all scanning activities) and a driving process. It is recommended to use the NTO Spider command line tool (C:\Program Files\Rapid7\AppSpider 6\ScanEngine\AppSpiderCMD.exe; you need to select to install it during installation) to drive ScanEngine.exe. It creates only one instance of ScanEngine.exe, and if a new ScanEngine.exe is started it will connect to it. You need to change project settings for attack module to start ScanEngine.exe automatically. This way when AppSpider command tool tries to run the scan, it will connect to the instance of ScanEngine.exe that is created by the Visual Studio in which you can debug the attack class.
It is recommended to follows the steps below:
-
Start AppSpider UI and create a scan config that will be used for debugging.
-
Change the Visual Studio attack module Project setting: Properties->Debug->Start External Program to ScanEngine.exe so that a new ScanEngine.exe is started every time you try to debug. Because ScanEngine.exe is a COM component, COM clients will automatically connect to the instance that you started.
-
To be able to hit breakpoints, you need to set the AttackModule project setting output directory to the config directory with the module DLL.
-
Make sure that no ScanEngine.exe is running (otherwise AppSpider Command Line tool may connect to a wrong ScanEngine.exe).
For every debug iteration, you need to:
-
Start Debug from Visual Studio (starting a new ScanEngine.exe which will load your attack class)
-
Run the scan using the Command Line Tool (AppSpiderCMD.exe) that will start the scan, e.g.
AppSpiderCMD.exe --config "C:\Documents and Settings\docauthor\My Documents\AppSpider\scans\myscan\myscan.scfg".