Site Structure
This panel allows you to observe the structure of the scanned site and review findings from the scan in the context of the overall structure of the site.
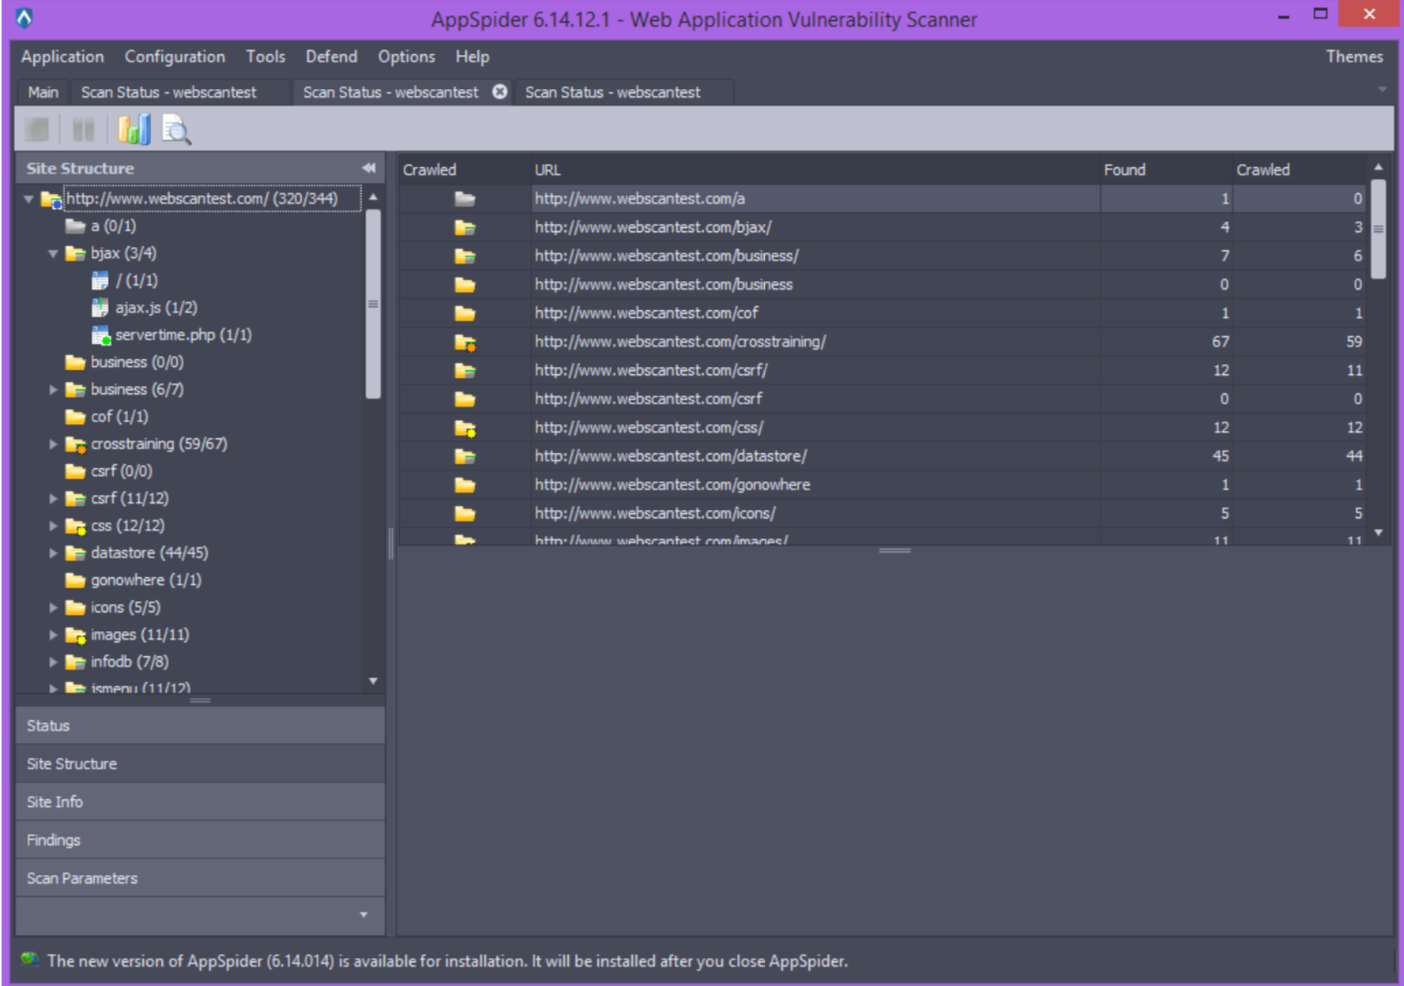
The Site Structure panel contains a tree structure of the crawled site. After the node is selected its direct children nodes are displayed on the Site Structure table. The table contains following columns:
- Crawled: an icon (either file or folder) indicating the crawl status of the object:
- Gray: not crawled
- Partial Gray: partially crawled (folders)
- Color: crawled
- Dot (in corner): there is an associated finding; right-click to go to the finding. The dots are color-coded depending on the severity of the finding:
- Red-High
- Orange-Medium
- Yellow: Low level finding
- Blue: informational
- Green: reflection analysis findings
- Method: request method (GET or POST)
- URL: the complete URL
- Code: the response code
- Length: the response length