Dashboards and reports
You can build custom views of the data you want to monitor using dashboards. Create a new dashboard or use an existing dashboard as a starting point. Then, add, edit, resize, and rearrange data visualization widgets to tailor the data view to you and your organization’s needs.
Navigate dashboards
The Dashboard feature consists of 5 main parts:
- Dashboards - a custom SIEM (InsightIDR) data view composed of data visualization widgets from the Dashboard Widget Library.
- Dashboard Library - pre-built dashboards that have been curated by experts at Rapid7. This library includes our compliance dashboards for ISO 27001. You can add pre-built dashboards to your dashboards list, and customize them to meet your needs.
- Widget Library - pre-built data visualization widgets that you can add to your custom dashboards. You can also customize pre-built widgets to meet your specific use case.
- Dashboard List - the list of all the dashboards created by users in your organization. You can access it from the Dashboards and Reports page by selecting the Dashboard Management tab.
- Widget Builder - the Widget Builder makes it easier for users to build custom visualizations that best suit their needs
Add pre-built dashboards
- Go to the Dashboards and Reports page.
- Select the Dashboard Library button to access the pre-built dashboards.
- Find the dashboard you want to add:
- Read the dashboard descriptions to learn more about each dashboard.
- Select Preview to view the widgets for a dashboard.
- Use the filters on the left to display the dashboards by category.
- Select Add to immediately add to your Dashboards list. You should only add Dashboards that are applicable to you.
Customize your Pre-Built Dashboard
Once the Dashboard has been added, it is fully customizable. You can edit the dashboard details or add, create and delete widgets to ensure your Dashboard meets your requirements.
Create a new dashboard
- From the SIEM (InsightIDR) left menu, select Dashboards and Reports.
- From the Dashboard Management tab, select the New Dashboard button. The New Dashboard modal appears.
- Enter a Dashboard Name and Description. The “Description” is optional, but it helps differentiate all of the dashboards at your organization.
- Select the Create Dashboard button. As soon as you select the Create Dashboard button, the dashboard is available in the dashboard list. However, it’s empty until you data visualization widgets to it, so you’re immediately directed to the Widget Library. From there, you can find, add, and customize widgets for your dashboard. Read Dashboard Widgets to learn all about customizing the data visualization widgets on your dashboard. If you can’t find a widgets you want in the Widget Library, build your own in the Widget Builder.
Edit an existing dashboard
You can edit, remove, resize, reposition, and add new widgets on any dashboard, including pre-built dashboards. Just open the dashboard and make your changes. They are saved automatically.
Edit the dashboard name or description
To edit the name or description associated with the dashboard, you can do so from the dashboard list or an open dashboard. Select the gear icon, select Edit Dashboard, then make and save your changes.
Edit dashboard details
- From the dashboards list, open the dashboard you want to edit.
- To adjust the data refresh rate of your dashboard, select a new value from the refresh rate dropdown list.
- To edit the widgets, select the gear icon on the widget you want to edit, select Edit, and make and save your changes.
Copy a dashboard
You may want to use an existing dashboard as a starting point for a new dashboard to save you time. If so, select the gear icon and select Copy Dashboard, then edit the copy as needed.
Dashboard widgets
Dashboard widgets contain visualizations of your data. Without widgets, your dashboard is just a blank screen. When you add widgets to a dashboard, you’re adding the data you want to see in that particular view. Dashboard widgets live in the Widget Library. The Widget Library contains the pre-built data visualization widgets you use to create dashboards. You can preview real data in the widget before adding it to your dashboard.
To access the library, select the Widget Library button from an open dashboard. You can then search for widgets using the search bar, or browse for widgets by category. From the Widget Library you can find Rapid7-created widgets, add them to your dashboard, and customize them to fit your needs. In each widget you can choose to use a LEQL query or pre-computed query.
Customize a pre-built widget
You can add a pre-built widget to your dashboard and customize the name, description, and data it displays.
To add and customize pre-built widgets:
-
Open an existing dashboard or create a new one.
-
Select the Widget Library.
-
Choose the widget you’d like to add to your dashboard.
-
Select Add to add the widget to your dashboard.
- Optionally, select Preview > Edit to change the name and description of the widget, then select Add to add the widget to your dashboard.
-
Click the gear icon on the widget you want to edit then select Edit.
-
Update the widget name and description at the top of the modal.
-
In the Data tab, choose the Type of query.
For LEQL queries:
- Enter a Series Name.
- Optionally, select a Saved Query.
- Set a time range in the For the Period field.
- Select a log set or log sets to query in your widget.
- If you’re not using a saved query, enter the Full Query.
For pre-computed queries:
- Enter a Series Name.
- Pick your query.
- Set a time range in the For the Period field.
- In the Chart tab, choose the Chart Type.
- The remaining options in the Chart tab will vary based on the chart type. Update any fields you choose to customize your widget.
Visualize widget data in layers
To visualize your widget data in layers, open the Edit modal and group by up to five fields in your full query.
Build a custom widget
You can build a custom widget that is specific to your requirements.
To build a custom widget:
-
Open an existing dashboard or create a new one.
-
Select Create Widget.
-
Enter a name and description for the widget at the top of the modal.
-
Choose the Type of query.
For LEQL queries:
- Enter a Series Name.
- Optionally, select a Saved Query.
- Set a time range in the For the Period field.
- Select a log set or log sets to query in your widget.
- If you’re not using a saved query, enter the Full Query.
For pre-computed queries:
- Enter a Series Name.
- Pick your query.
- Set a time range in the For the Period field.
- Optionally choose to Add Another Data Source and repeat the necessary steps.
- Select Next.
- In the Chart tab, choose the Chart Type.
- The remaining options in the Chart tab will vary based on the chart type. Update any fields you choose to customize your widget.
Pre-computed queries
Pre-computed queries are best suited for widgets when your queries span a large time range, you’re querying a large amount of data, you routinely search with the same LEQL statement, or if your searches typically take a long time to return results.
You must have the correct permissions to create pre-computed queries
Only SIEM (InsightIDR) administrators or analysts can create pre-computed queries.
Customize a widget with pre-computed queries:
- Select a dashboard > click + Create Widget.
- Enter a name and description for your dashboard widget.
- Set the query toggle to Pre-Computed Query.
- Click Select a query and choose the pre-computed query you want to add to your dashboard widget.
- Fill in the remaining fields.
- Click Next.
- Click Save.
Add pre-computed queries to existing widgets:
- Choose a widget to add a pre-computed query to.
- Select the gear icon on your widget and click Edit.
- Set the query toggle to Pre-Computed Query.
- Click Select a query and choose the pre-computed query you want to add to your dashboard widget.
- Click Save Changes.
By default, any widget that a pre-computed query is added to will populate with data from the 30 days before the creation of your pre-computed query. If you make any edits to the pre-computed query, the data displayed in the widget will be based on the 30 days before any changes are made.
It may take some time for the entirety of the data to be visible in your widget due to the amount of data that needs to be processed and the specified time frame.
You may notice a delay in your widget's data visualization
Dashboard widgets do not automatically populate with pre-computed query data if your time range exceeds 30 days. Pre-computed query data is populated in a widget based on the 30-day period before your pre-computed query was created plus the specified timeslice and time range.
For example, if you specify a time range of 90 days, you will be able to view data from 30 days before the creation of your pre-computed query and the next 60 days following the creation of the pre-computed query. Your data will continue to populate in the dashboard widget as time goes on.
The 30-day period will reset if any edits are made to the pre-computed query.
View dashboards
Select the All Dashboards button to access a list of dashboards created by users in your organization. You can then open and view any dashboard in the list by clicking the dashboard name.
Filter dashboards
Dashboard filtering gives you another level of flexibility to find the insights you want. By default, no filter is applied to your dashboard.
To apply a filter:
- At the top of your dashboard, select the filter icon.
- Select Edit and either select a saved query from Log Search or type a valid query. As you type, syntax highlighting displays the different syntax elements in contrasting colors to help you build a query.
- Select Apply. This filter will be applied to all widgets on your dashboard.
- Select Save to either save the filtered view to your current dashboard or use the filter to create a new dashboard.
Widgets using pre-computed queries are not compatible with dashboard filters
Pre-computed queries can only be added to individual dashboard widgets. To apply a dashboard level filter, rewrite your chosen pre-computed query as a LEQL query. Loading times for widgets using LEQL queries may be slower.
You can also create reports from your filtered views by clicking Create Report.
Filter examples
To filter your dashboard to focus on a specific asset or user, you could create the query “asset=ExampleCollector”. Then, select “Apply” to filter your dashboard. How you can leverage dashboard filters:
- Create a network perimeter-themed dashboard and then use dashboard filters to focus on a specific IP address or asset.
- Build a cloud-focused dashboard and then use dashboard filters to focus on activity associated with a single EC2 instance
- Create a network activity dashboard and then use a domain filter like “dropbox” to focus on any Dropbox activity on a network
Manage dashboards
As the number of dashboards you generate increases, you might need to tag and organize them. From the Dashboard Management tab, you can:
- Set favorites to keep track of your most important dashboards.
- Easily filter the list of dashboards by favorites, owner, or tags.
- Manage and assign tags to dashboards.
- Delete multiple dashboards at once.
- Reassign dashboards to new owners.
Manage reports
You can easily create, schedule, and send reports to anyone you want. You can also access streamlined report management tools on the Report Management tab.
Create and schedule a report
You can create a report either from within a dashboard or from the Report Management tab.
After a report is created, you can:
- Download or share the report to others in your organization within an email as a PDF, HTML, or CSV file.
- Set the report to be sent on a specified schedule.
Create and schedule reports from a dashboard
- From the SIEM (InsightIDR) left menu, select Dashboards and Reports.
- Select the dashboard that you want to report on.
- Select the Create Report dropdown.
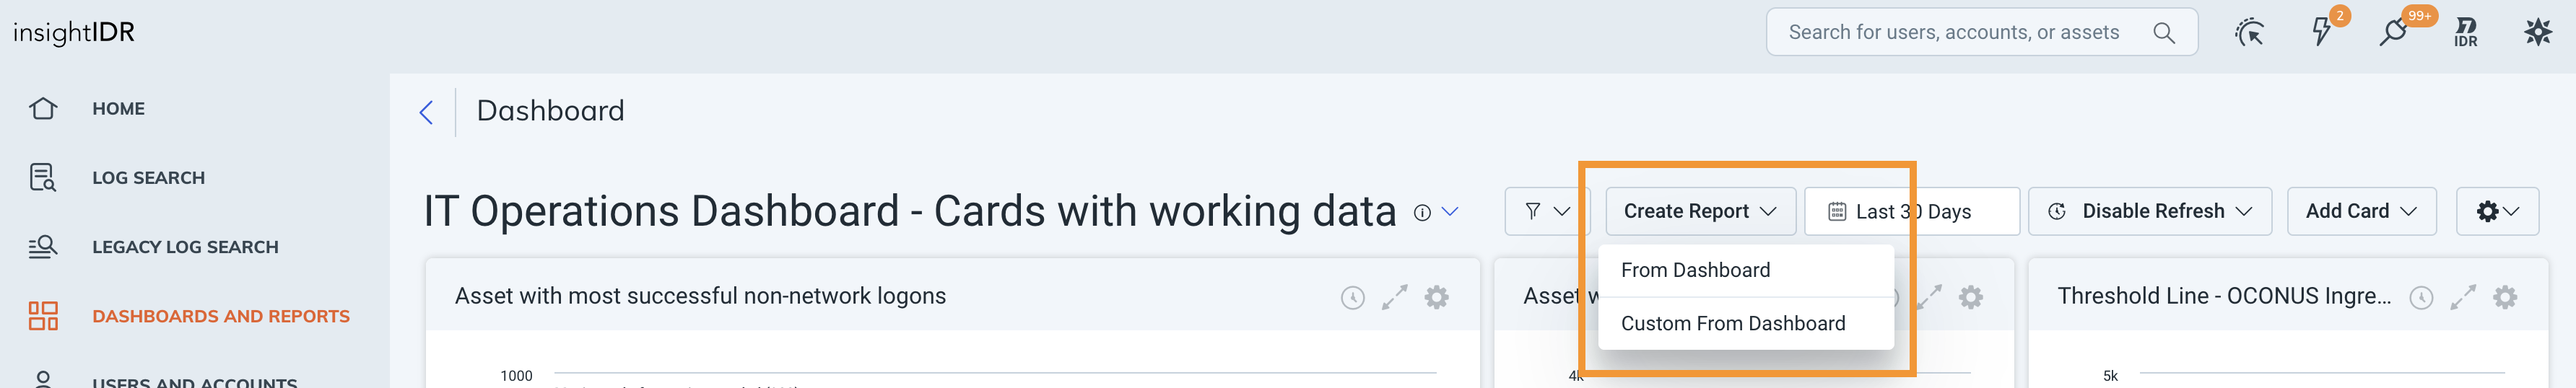
- Choose From Dashboard to generate a static dashboard report, or Custom From Dashboard to have the ability to modify it in the report builder.
- From Dashboard creates a report linked to the dashboard.
- Any future changes made to the dashboard will be reflected in the report.
- Custom From Dashboard creates a new report that can be customized and will not be linked to the dashboard.
- Any changes to the report will need to be made directly in the report from the Report Management tab.
- Customize your report by adding widgets from the Widget Library or from your dashboards, editing section names and descriptions, and adjusting the layout with move and resize options.
- From Dashboard creates a report linked to the dashboard.
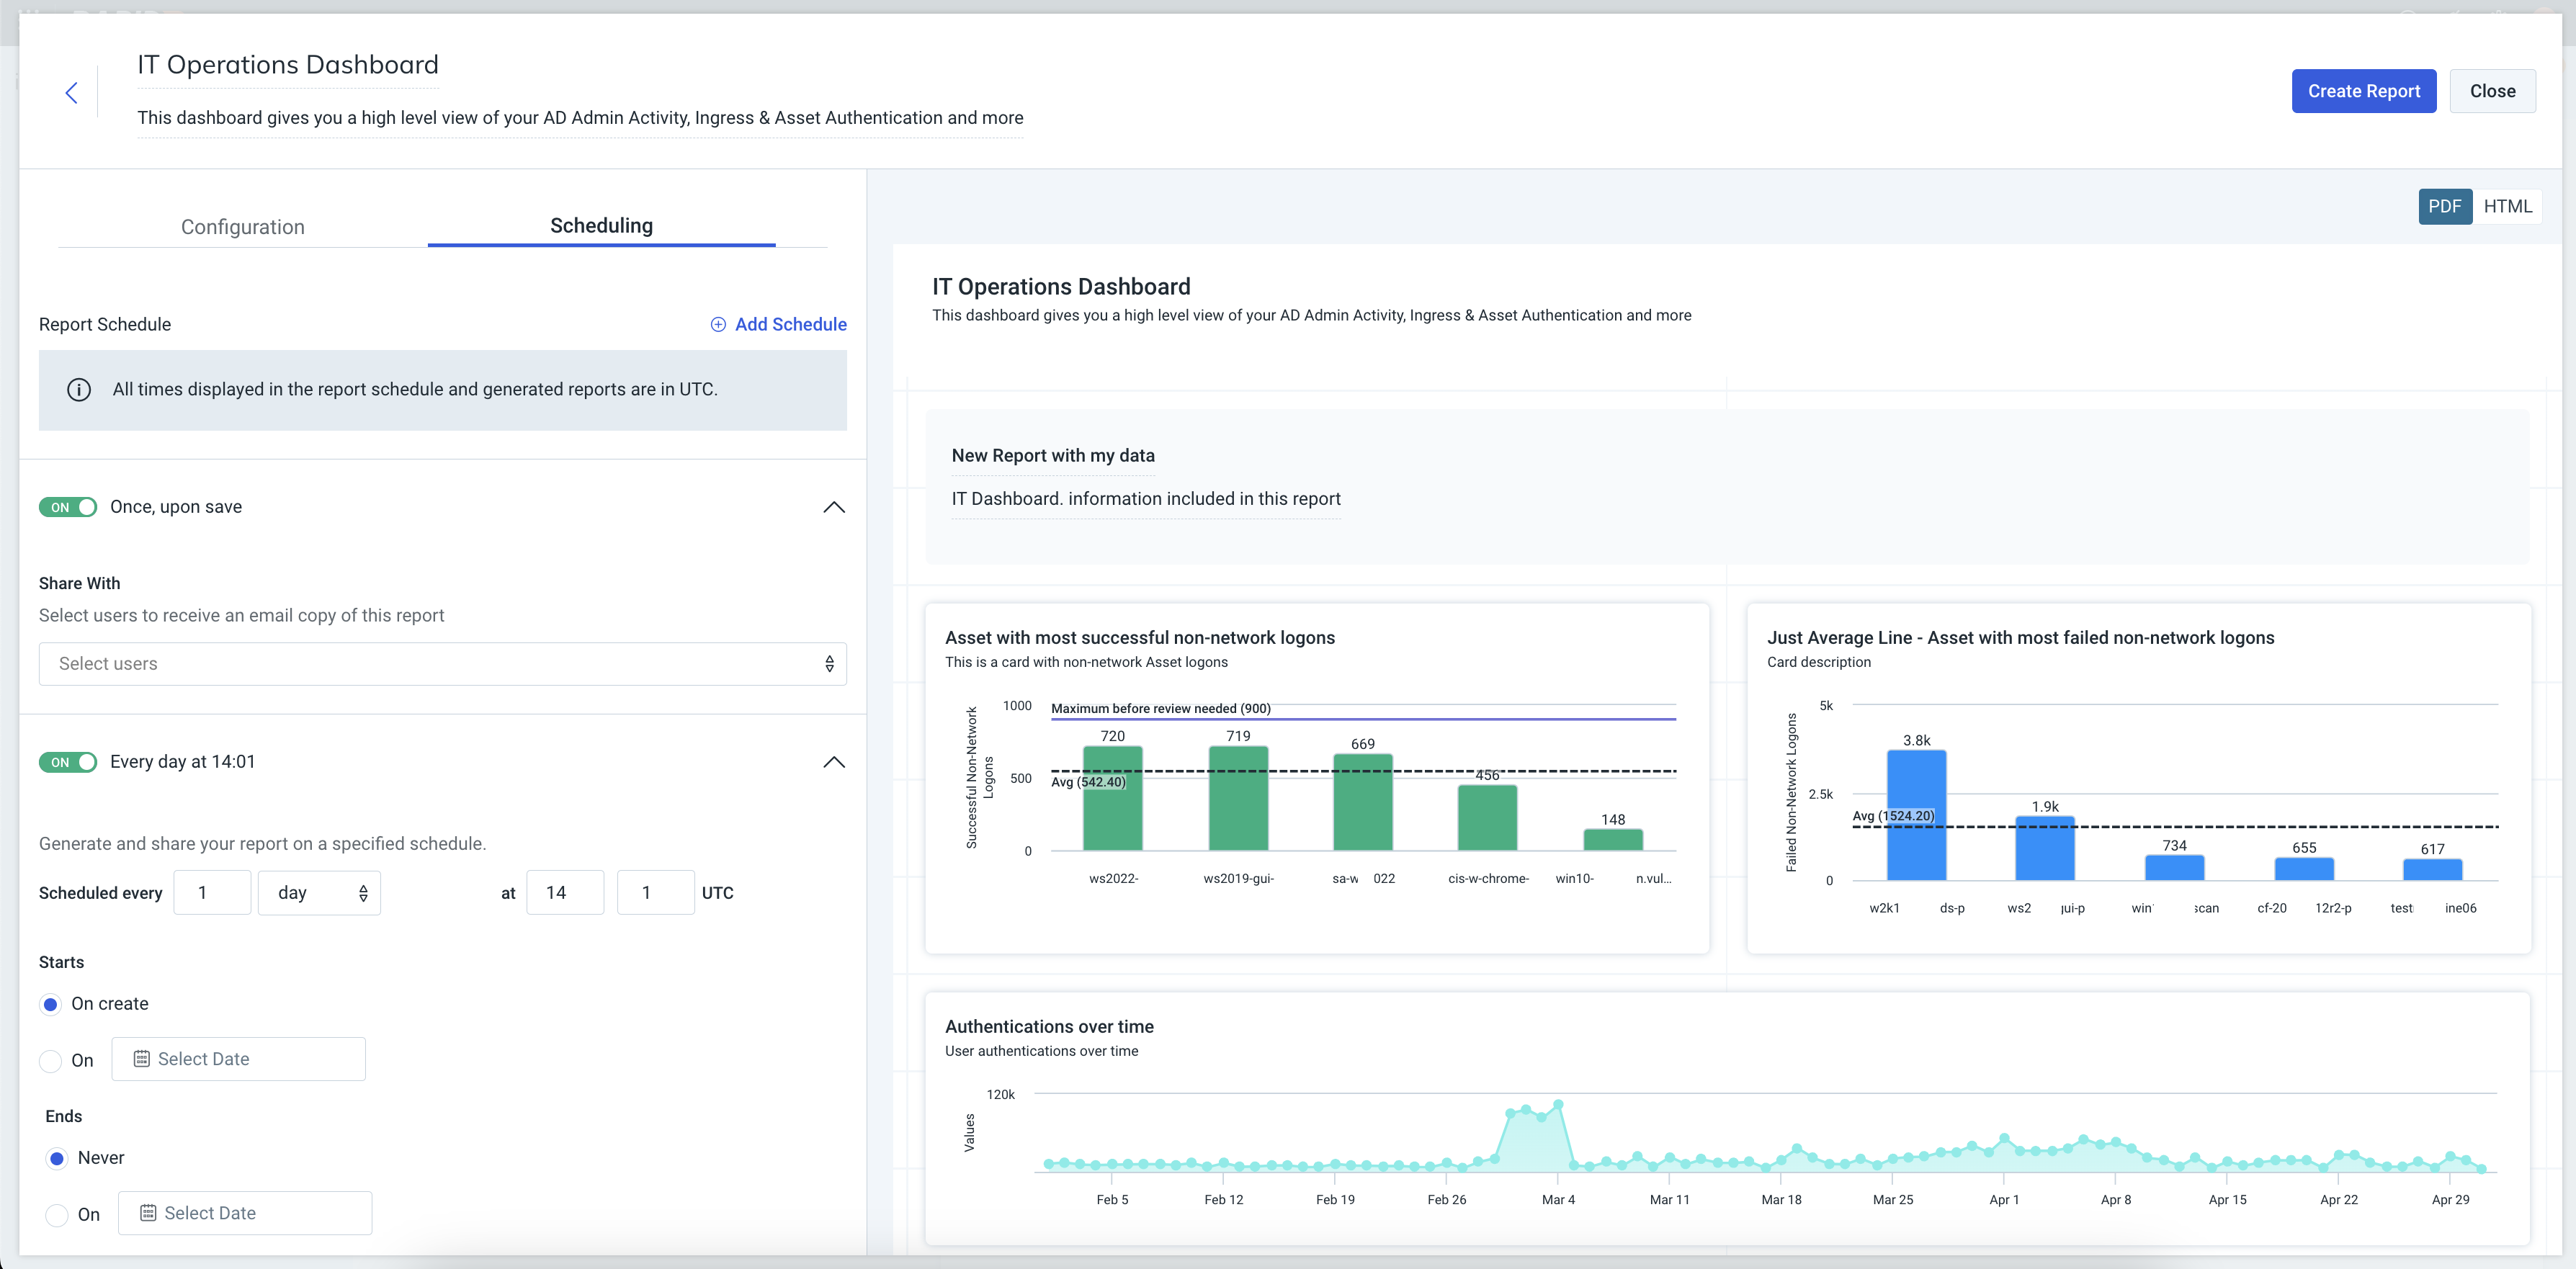
- Enter a report name and description.
- Select your desired report format. You can select PDF, HTML, CSV or all three.
- Optionally, if creating From Dashboard, choose if you’d like the report to use saved dashboard filters.
- Select Add Schedule to generate and share your report on a specified schedule.
- Select Create Report to save your changes.
Create and schedule reports from the Report Management tab
- From the SIEM (InsightIDR) left menu, select Dashboards and Reports.
- Navigate to the Reports tab.
- Select the Create Report dropdown.
- Select one of these options:
- New - Start from a blank report.
- From Dashboard - Use a pre-existing dashboard as a template.
- From Template - Browse the Report Library for a template to suit your needs.
- Customize your report by adding widget from the Widget Library or from your dashboards, editing section names and descriptions, and adjusting the layout with move and resize options.
- Choose the report format. You can select PDF, HTML, CSV or all three.
- Optionally, in the Scheduling tab, select Add Schedule to generate and share your report on a specified schedule.
- Click Create Report to save and generate your customized report.
Editing reports that aren't linked to dashboards
Reports that are created from the Report Management tab are not directly linked to a dashboard. To make changes to your report, return to the Report Management tab, search for your report and click Edit.
As the number of reports you generate increases, you might need to tag and organize them. From the Report Management tab, you can:
- Set favorites to keep track of your most important reports and schedules.
- Easily filter the list of reports by favorites, owner, tag, or the date the report was generated.
- Manage and assign tags to reports.
- Delete multiple reports at once.
- Reassign reports to new owners.