Manage Goals and SLAs
After you create a goal, it appears in the Goals tab. Click the Goals icon in the left navigation to see the Goals tab and the Recommended Goals tab.
View All Goals
The Goals tab contains a list of your organization’s goals. You’ll also see high-level details of each goal.
Roles Required
Anyone within your organization can view any of the goals on the Goals tab if they are:
- A Nexpose global administrator who has an Command Platform (Insight Platform) account
- A Nexpose non-global administrator on a Nexpose security console who is a site administrator and also has an Command Platform (Insight Platform) account
- A user whose Insight account was created by the Command Platform (Insight Platform) Administrator
Warning - Goal Editing and Deletion by Other Users
If anyone in your organization fits into the “Roles Required” list above, they can view, edit, or delete any goal, regardless if they created them or not.
Goals Overview
High-level goal information indicating progress of your organization’s goals appears in the horizontal bar at the top of the screen:
- Goal number - Total number of goals that have been created
- Goal status - Number of goals by status
- You can filter the goals table by status by clicking it.
- Green - Compliant/On Track
- Yellow - At Risk
- Red - Not Compliant/Not Met

View Individual Goal Overview
Information about individual goals include the following and can be sorted:
- Assets/Vulnerabilities - Number of assets or vulnerabilities that affect a goal
- Status - Denotes the goal’s state by dot color
This will vary based on goal type.
- Goal type - Denotes if the goal is time bound, SLA, or continuous
- Time Remaining - Denotes how much time is left before the goal is completed
- Created On - Date the goal was created
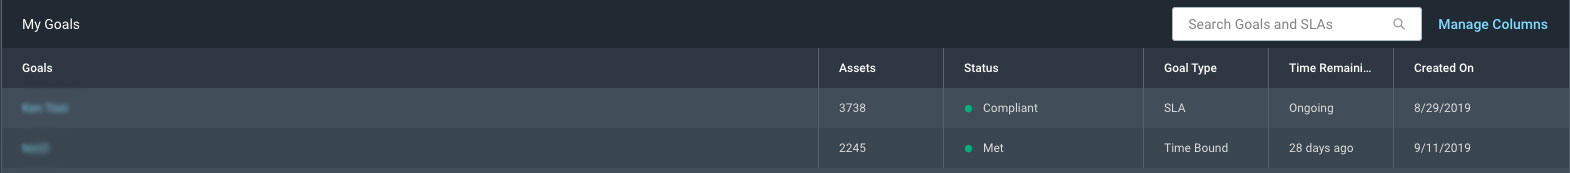
To customize the order of your goals table, click Manage Columns next to the search box. You can choose which columns you want to see and reorder the columns in the table by dragging the headers in the order you want.
Edit, Copy, and Delete
Individual goal rows will show additional icons on mouseover towards the right side of your screen.
View Goals Details
Click the name link of any goal in your table to see more information about it. While the layout of information is the same for all goals, the data populating the fields can vary based on goal type, scope, and query. We highlight those differences in this section.
View Individual Goal Overview
The “Goal Overview” section shows details of your goal. Click the pencil icon to edit your goal. This launches the goal wizard so you can edit your “Manage Goal” details.
Note - Goal Editing Capability
You can only edit a goal by changing its name, description, or dashboard assignment. We do not support editing the scope or conditions at this time. If you want to edit the scope or conditions, you need to create a new goal.
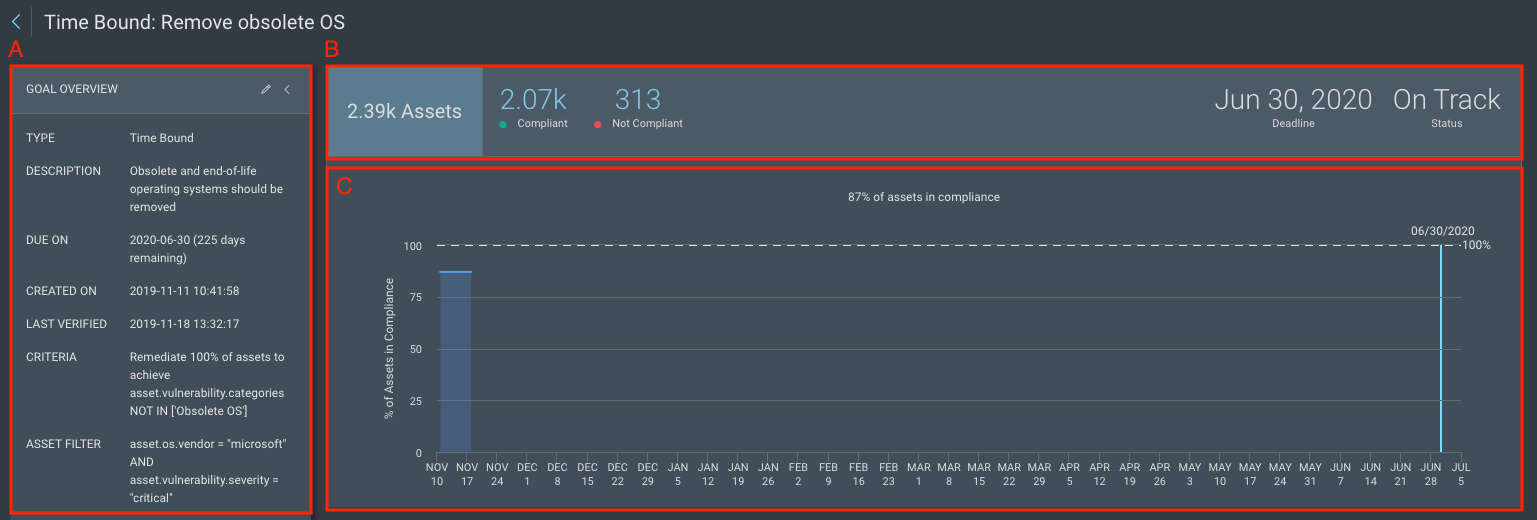
A. Goal Overview - This section contains general information about the goal, which includes:
- Type - Goal type (time bound, continuous, or SLA)
- Description - Description of the goal (if you wrote one while creating your goal)
- Due On - Date you want your goal met (only applies to time bound goal)
- Created On - Date you made your goal
- Last Updated - The last time the goal was updated with new data.
- Criteria - Conditions the goal must meet
- Asset Filter - Query used to narrow asset scope down
- Vulnerability Filter - Query used to narrow vulnerability scope
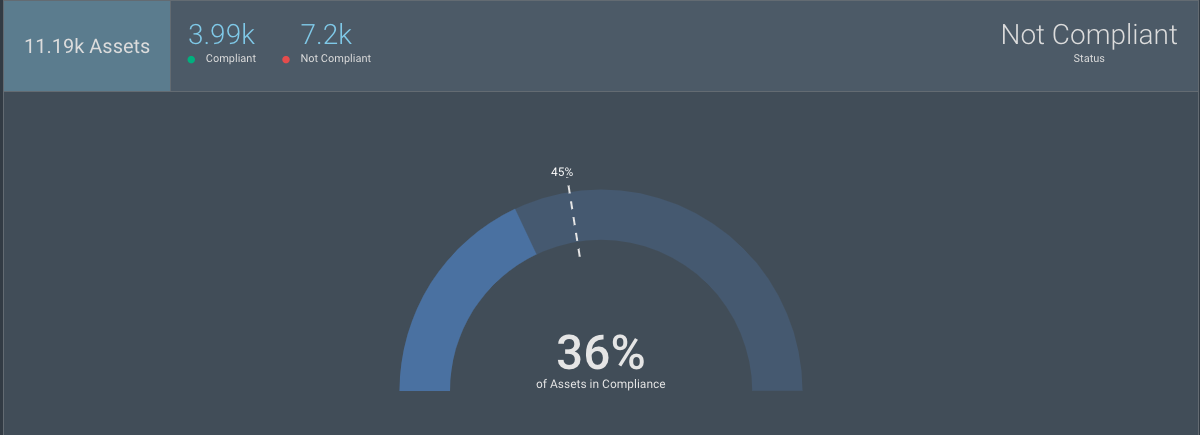
B. Status bar - This section contains the number of affected assets or vulnerabilities, the number of assets or vulnerabilities that are compliant, in grace period (applies only to SLAs,) and not compliant or past due (applies only to SLAs), deadline (applies only to Time Bound), and goal status.
- Met (applies to Time Bound)
- Compliant (applies to Continuous and SLAs)
- Not Compliant (applies to Continuous and SLAs)
C. Data visualization - The visualization varies based on goal type:
- Continuous - Gauge depicts the percentage of assets in compliance
- Time Bound - Graph with dates along the x-axis, starting from the date you created the goal The dotted line shows the percentage of assets that you want to meet to accomplish your goal, while the solid blue line shows the actual percentage. So, if your solid line is above the dotted line, you are successfully meeting your goal, while a solid line below indicates that some work needs to be done. The vertical line represents your due date.
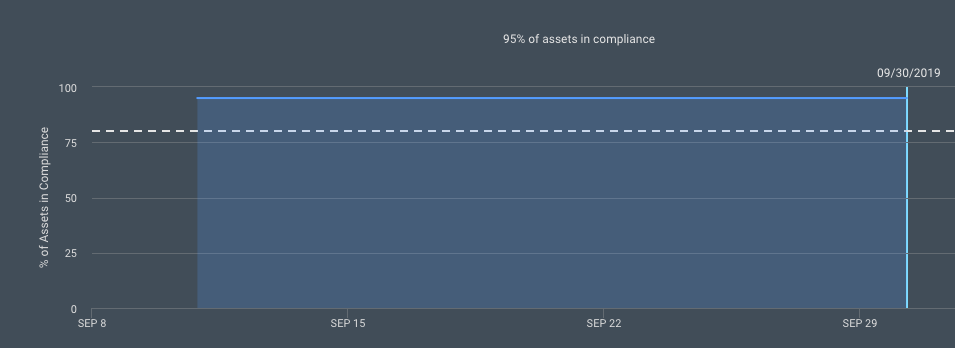
- SLAs - Graph with dates along the x-axis, starting from the date you created the goal The y-axis measures either the percentage or total number of assets in scope that you want to meet your goal’s criteria. The thin blue line shows the percentage on the left y-axis, while the thicker gray line shows the total number of assets on the right y-axis.
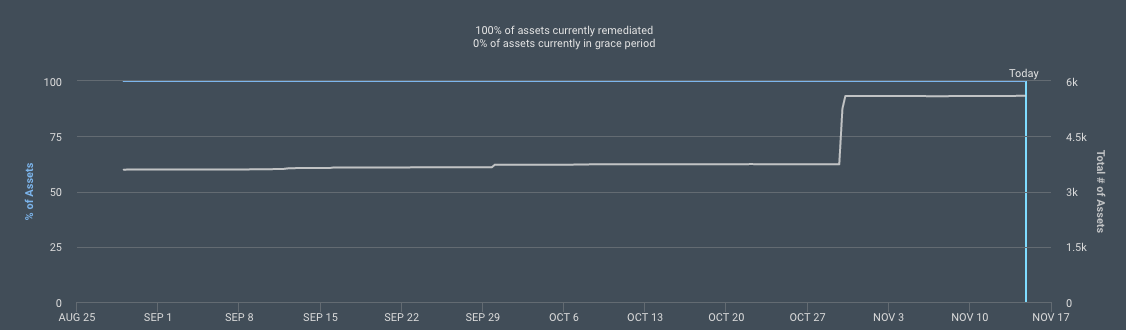
Note - Scan-based Data Points
When you first create an SLA, you might not see trending data or a horizontal line immediately. This is because these data points are based on your scan settings. It might take several scans to map data points, especially if scans are spaced apart.
SLA Detail Overview
The information in SLAs vary from Time Bound or Continuous goals, which we’ll explain in this section.
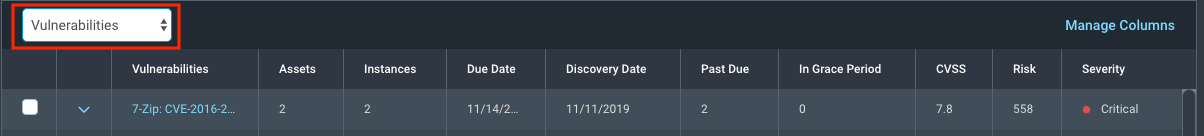
Click the name link of any SLA in your “Goals” table to see details about it. You can see detailed data surrounding your assets or vulnerabilities by selecting Assets or Vulnerabilities from the menu dropdown on the table below the visualization.
Here’s a breakdown of the information that appears:
A. Goal Overview - Similar to the “Goal Overview” mentioned earlier, click the pencil icon to open the goal wizard if you need to make any edits.
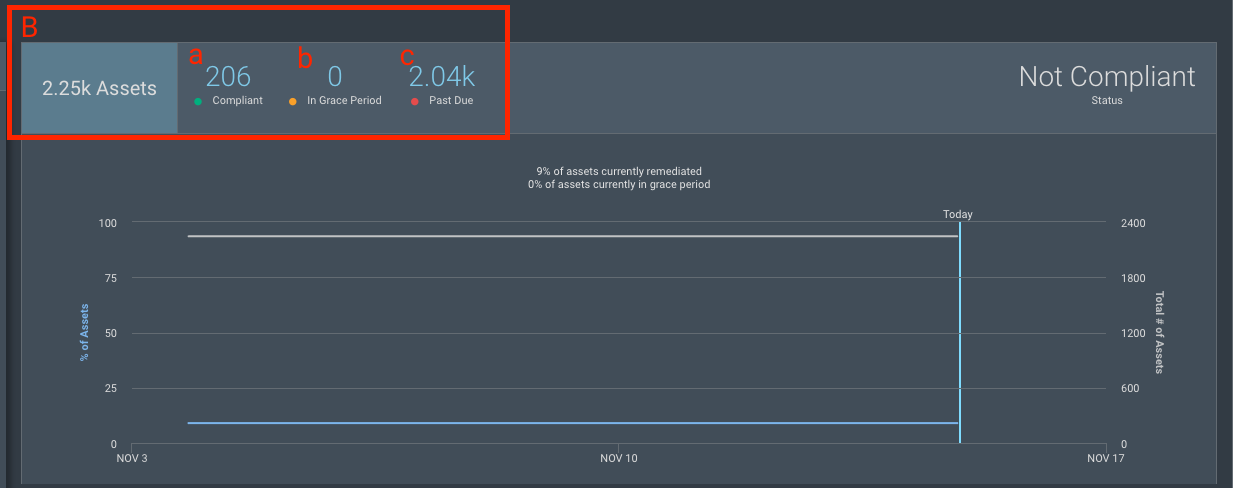
B. Status bar - Key performance indicators (KPIs) When you click on a KPI and scroll down, you see a table that lists the assets or vulnerabilities in that particular category.
a. Compliant or Remediated - This can vary, depending on the type of SLA you made:
i. If you made an asset-based SLA, it will display Compliant, which is the number of assets that have been remediated within the time window since their discovery.
ii. If you made a vulnerability-based SLA, it will show Remediated, which is the number of vulnerabilities that have been remediated within the time window since their discovery.
b. In grace period - Indicates the number of assets that have not been remediated yet, but are within the time window since their discovery
c. Past due - Indicates the number of assets that have not been remediated yet and are outside the time window since their discovery
Note - KPIs Filter Your Assets or Vulnerabilities Table
Click a status to view the data related to that KPI. You can then export to CSV.
C. SLAs Data Visualization - See the SLAs visualization explanation above. D. Assets and Vulnerabilities Data Table - As mentioned earlier, select Assets or Vulnerabilities from the menu dropdown on the table to see detailed data surrounding your assets or vulnerabilities. You can sort all columns in the asset and vulnerability tables.
Note
When you first create an SLA, you might not see trending data or a horizontal line immediately. This is because these data points are based on your scan settings. It might take several scans to map data points, especially if scans are spaced apart.
Export to CSV
There are multiple ways to customize your data for CSV export:
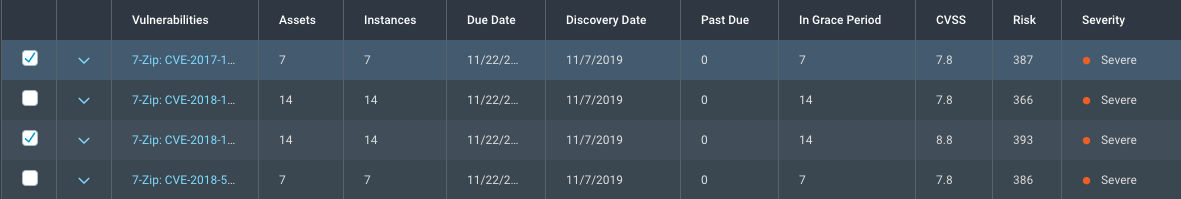
- Check the box next to the Export to CSV button to select all the rows in the table below that shows assets or vulnerabilities. You can select or deselect individual rows if you don’t want to include them in the export file.
- Select rows individually. In this example, the first and third row will be exported as a CSV file.
- Select a KPI to display relevant data in the data table.

After you’ve identified what data you want to export, click Export to CSV to download.
Create a Static Remediation Project
To translate your goal into a solution-based remediation effort, click Create a Static Remediation Project, which will launch the Remediation Projects wizard. This is only available for goals that involve static assets. To learn more about remediation projects and the difference between static and dynamic assets, see our Remediation Projects and Working with Asset Groups help documentation.
There are multiple ways to select your data to create a static remediation project:
- Select the check box next to the Export to CSV button to select all the rows in the table below that shows assets or vulnerabilities. You can deselect individual rows if you don’t want to include them in the export file.
- Select rows individually.
Data Details Table
You’ll find these details to help you take action:
- Due date - Applies to assets and vulnerabilities. This is when the grace period ends.
- Discovery date - Changes based on if you’re looking at vulnerabilities or assets.
- Vulnerabilities - The discovery date of the vulnerabilities.
- Assets - The time when an asset that does not meet the criteria is discovered.
Recommended Goals
Select Recommended Goals to see goals that will enhance your security operations. Selecting a card will pre-configure the query field of the goal wizard, but you can finetune the parameters to meet your organization’s needs.