Understanding the Credentials Domino MetaModule Findings
After you launch the Credentials Domino MetaModule, the findings window appears and displays the real-time results and events for the attack. You can quickly see the impact of the attack on the target network and identify the possible attack routes.
To help you navigate the data, the findings window is organized into two major tabs: the Statistics tab and the Task Log tab.
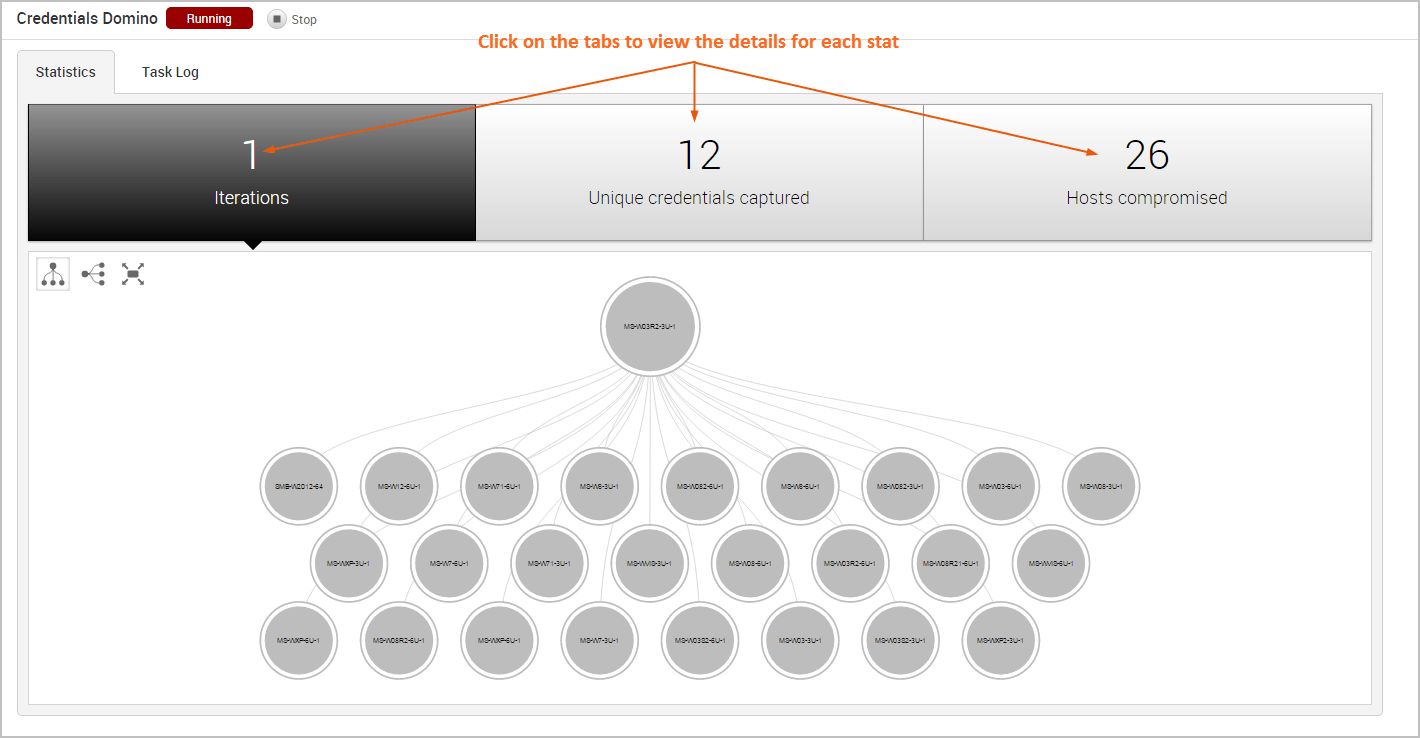
The Statistics Tab
The Statistics tab tracks the real-time results for the attack. It displays statistics for the following:
- The total number of iterations that the MetaModule performed
- The total number of captured credentials
- The total number of compromised hosts
Each statistic is displayed on its own tab. You can click on any of the tabs to view the corresponding details for the statistic.
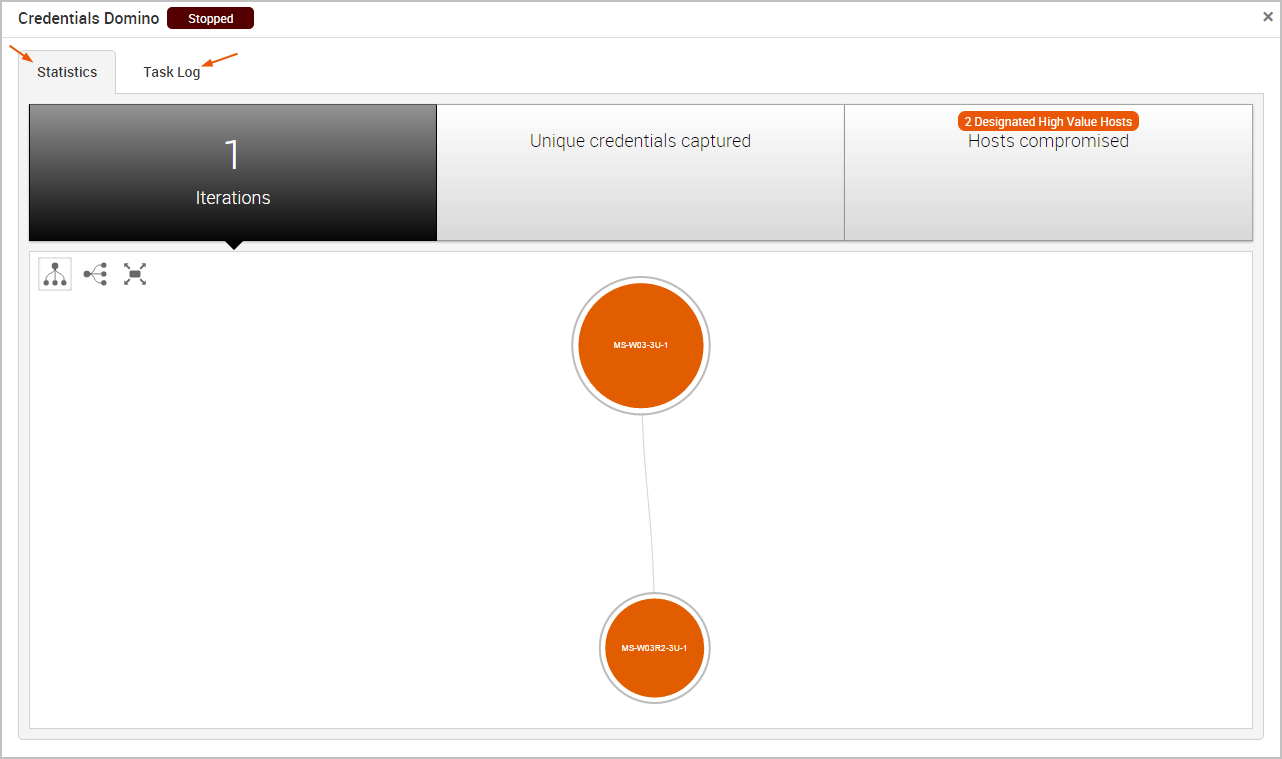
Viewing the Attack Visualization
To help you visualize the attack routes that the MetaModule was able to establish, the findings window includes an attack visualization that graphically shows the relationship and hierarchy between each compromised host on the network. The visualization uses a tree structure and presents each host as a node on the tree. The starting node is the initial host that the MetaModule used to start the attack.
The attack visualization uses a hierarchical format to connect hosts that are linked to other hosts. The connection between two nodes is created when a credential from one host is used to compromise another host. You can mouseover a node in the attack visualization to highlight the attack route that was used compromise the host.
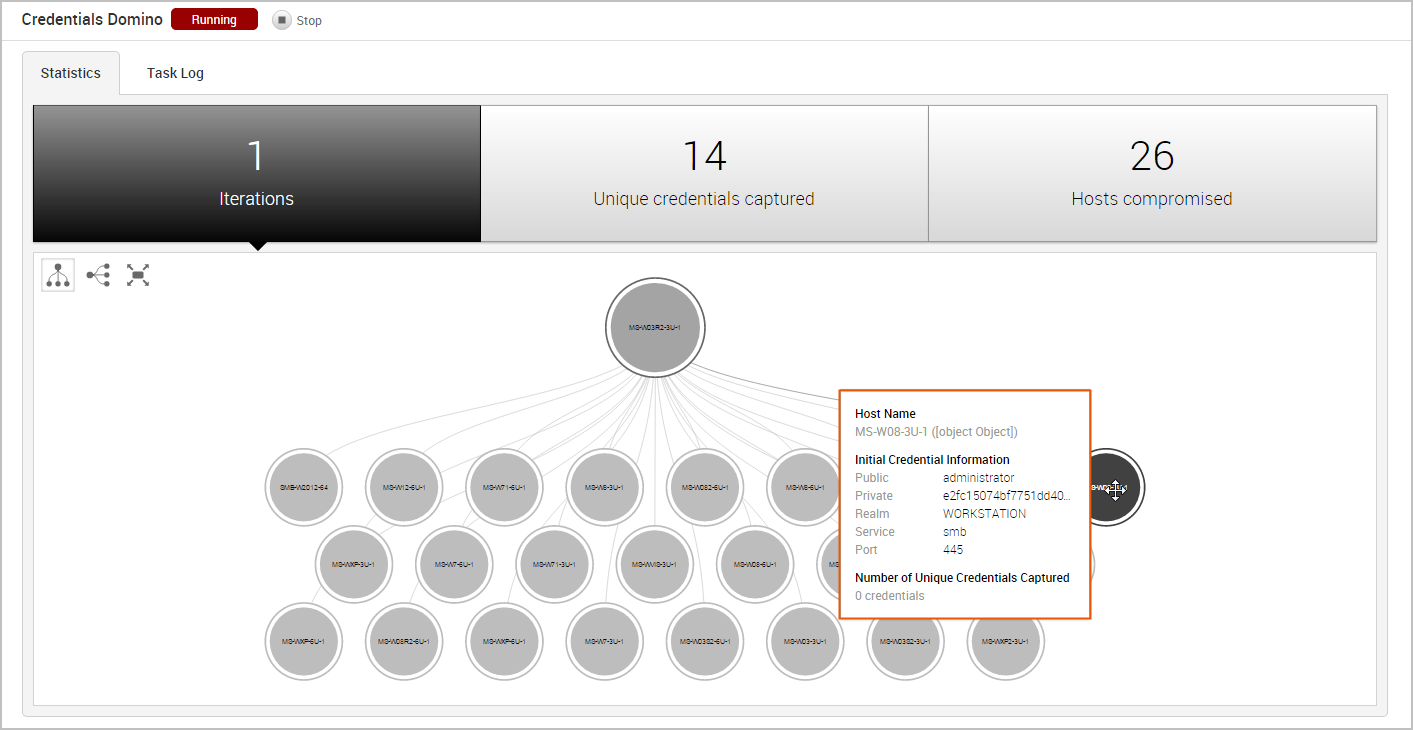
Each iteration represents a level on the tree, so the attack visualization can become quite large if the MetaModule performed multiple iterations of the attack. For example, if the MetaModule performed 20 iterations of an attack, there will be 20 levels represented on the attack visualization. If this happens, you can scroll or double-click the tree to zoom in to view a smaller set of nodes, or you can hover over a specific node to see the details for that host, such as the host name, operating system, credential information, and captured credentials count.
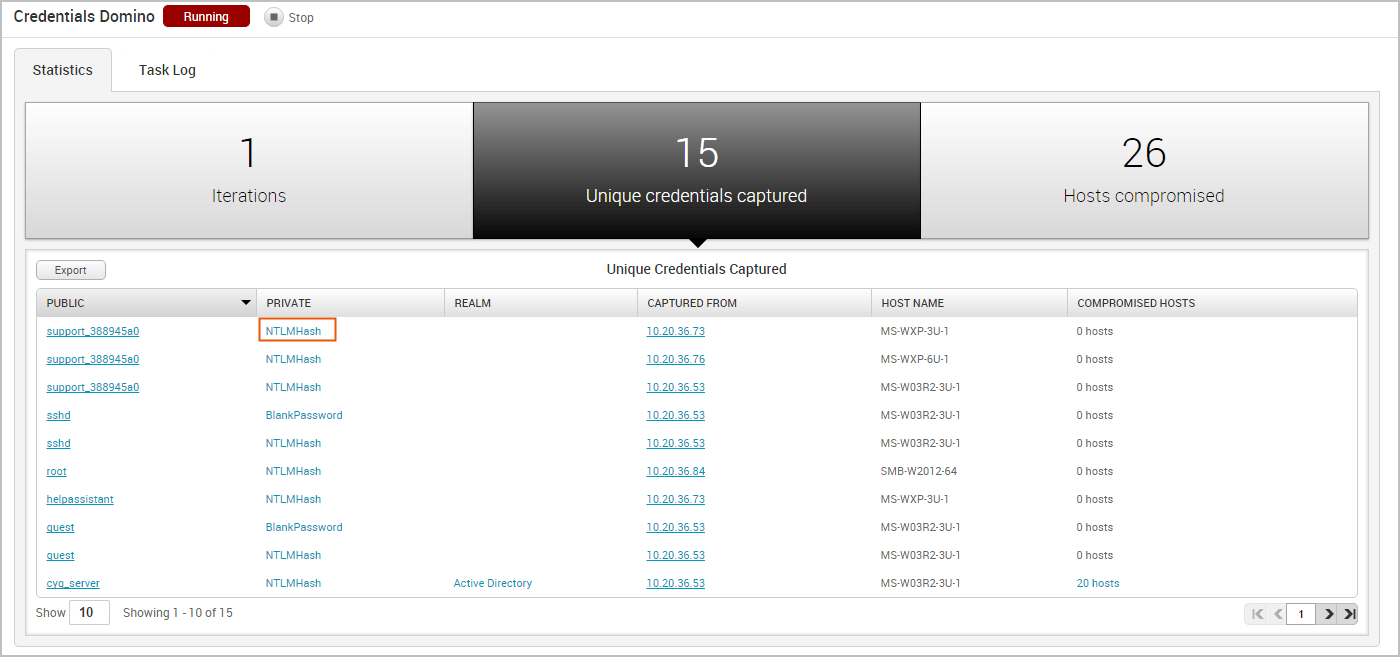
Viewing the Unique Credentials Captured
The Credentials Domino MetaModule tracks credentials that do not share the same public, private, and realm with other captured credentials. It displays this count on the Unique Credentials Captured tab and continuously updates the count in real-time.
For each unique credential captured, the Unique Credentials Captured table shows the public value, private value, realm type, source host IP, source host name, and the number of hosts from which the credential was captured.

If the credential is a hash or an SSH key, the Private field displays the credential type instead of the private value. You can click on the private type to view the private value.
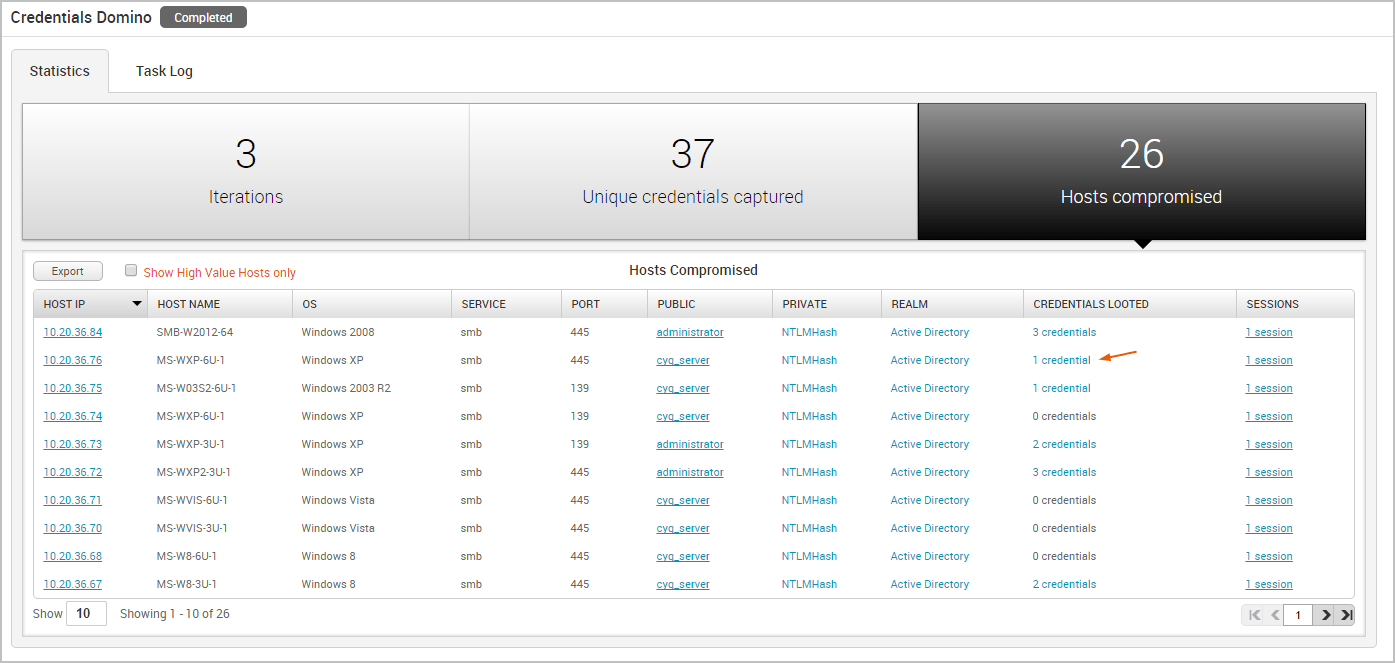
Viewing Hosts Compromised
The Credentials Domino MetaModule tracks hosts on which it was able to open sessions. It displays this count on the Hosts Compromised tab and updates the count in real-time.
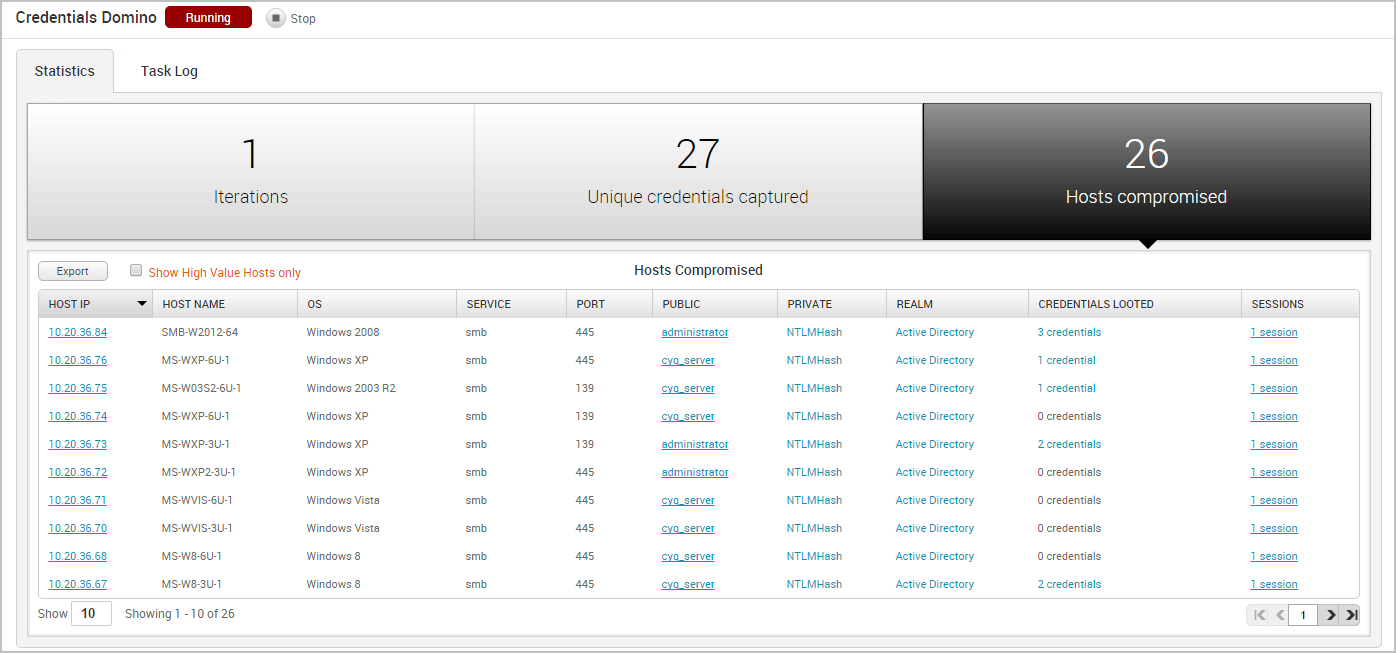
The Hosts Compromised table lists the host IP, host name, operating system, service name, port, public, private, realm type, number of looted credentials, and a link to the session for each compromised host.
To view a list of the credentials that were captured from the host, you can hover over the credentials count in the Credentials column.
To access the details page for an open session, click on the session link in the Session column.

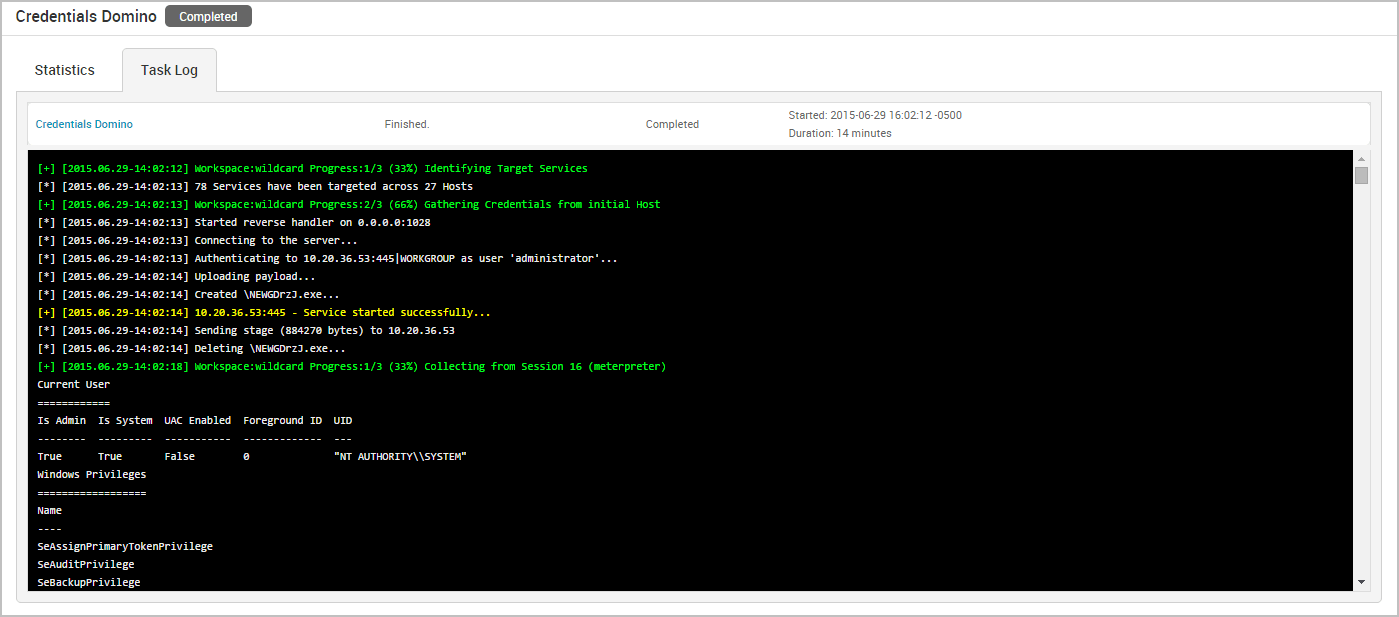
The Task Log Tab
The task log tracks the activity for the MetaModule, such as the host and credential pair combinations that have been attempted and the results of those attempts. The task log also documents any errors or failures that occurred during the attack and can be used to troubleshoot any issues related to the MetaModule run. This is especially helpful if, for example, the MetaModule has been running for a long time, appears to be hanging, or does not complete.