Strategic Intelligence
The Strategic Intelligence dashboard enables CISOs and other security executives to assess, plan, and budget for future security investments:
- View potential vulnerabilities in your environment via which threat actors may be able to execute a successful attack – aligned to the MITRE ATT&CK framework (tactics & techniques).
- See trends in your external attack surface, and track progress over time in those exposed areas.
- Benchmark your exposure relative to other Digital Risk Protection (Threat Command) customers in your sector/vertical.
- Easily communicate gaps and trends to management using the dashboard and reports.
Strategic Intelligence is based on alerts that were reported for your company, providing an intelligence solution that is tailored to your company.
The Strategic Intelligence feature is enabled as an Open Preview.
During the Open Preview period, users can use and review the MITRE ATT&CK Dashboard and provide feedback to Rapid7. This feedback will be important as Rapid7 improves and expands the Strategic Intelligence functionality towards the general availability release.
Open Preview features are available for a limited time. Before the features are revoked, we will notify you.
MITRE Dashboard
Use the Strategic Intelligence MITRE dashboard to:
- View your company exposure score based on your Digital Risk Protection (Threat Command) account history and relative to your sector or vertical.
- Examine the exposure score over time to spot trends.

Let’s describe the different features on the dashboard!
Overall Exposure Score
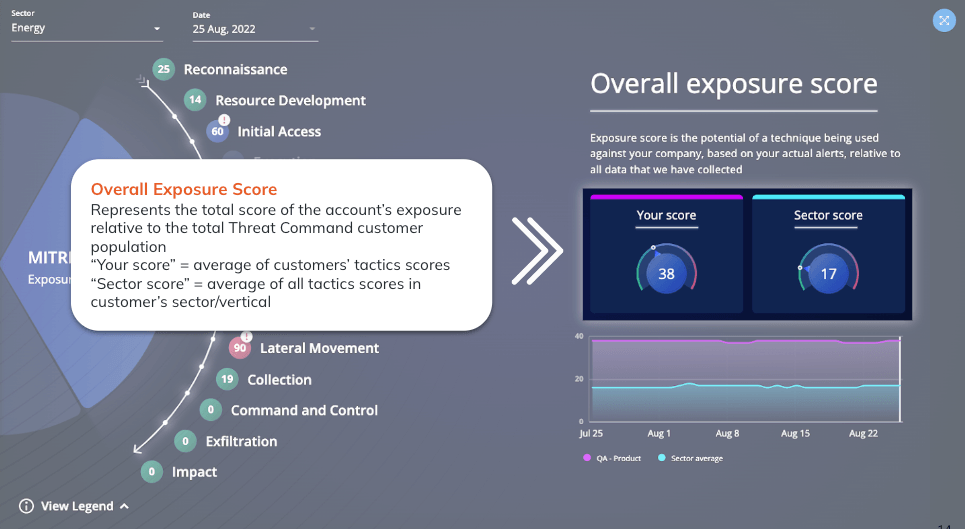
The exposure score represents your total exposure relative to all other Digital Risk Protection (Threat Command) customers. You can compare your score to different sectors by selecting that sector in the benchmark selection area.
MITRE Tactic Score
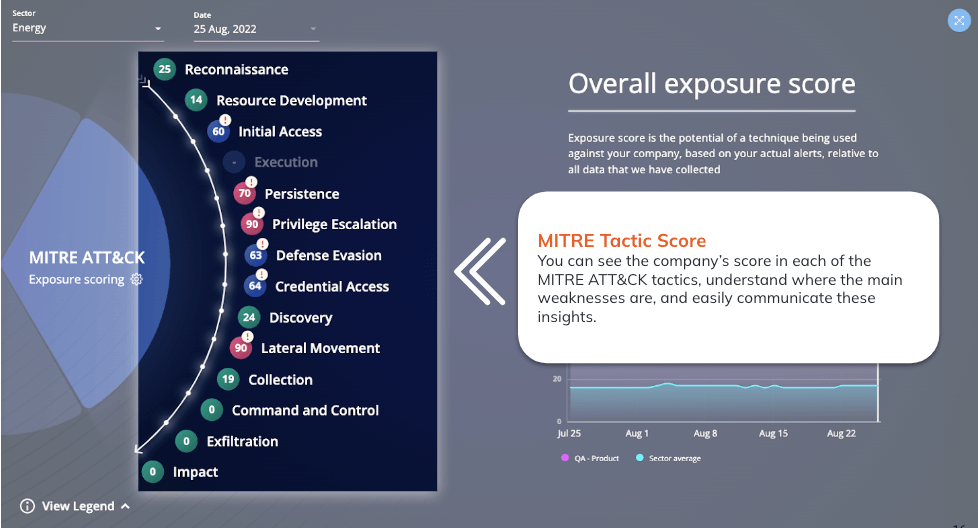
The MITRE tactic score shows the company’s risk in each of the MITRE tactics.
Each score includes the following parts:
- How exposed is your environment to a particular tactic?
- The closer the number is to 100, the higher risk your company is at.
- How does your risk compare to that of the selected sector.
- If there is an
 icon, your average risk is significantly greater than the sector average.
See the legend in the lower-right of the dashboard for more score indications.
Exposure score
Your company exposure score is based on actual alerts reported for your company, including open alerts and closed alerts (excluding alerts closed for “false-positive-like” reasons, such as: Policy rule, Not related to my company, False-positive, A legitimate website/application, Informational only). “False-positive-like” closed alerts are excluded so the data shown is more relevant.
Alert closing reasons are selected when an alert is closed. The alerts included in the Strategic Intelligence dashboard are updated hourly; changes made (such as opening excluded alerts or changing closed alert reasons) will be reflected within an hour.
You can change which closed alerts are included in the calculation, for example changing the defaults or excluding other closed alerts.
To change which closed alerts are included in the exposure score:
- In the MITRE tactic section, click the
 next to Exposure scoring.
 - Select the closed alerts to be included in the calculation.
To which techniques does my company have the highest exposure?
To answer this question, click a tactic in the MITRE tactic score section. The tactic techniques are shown in place of the Overall exposure score section:
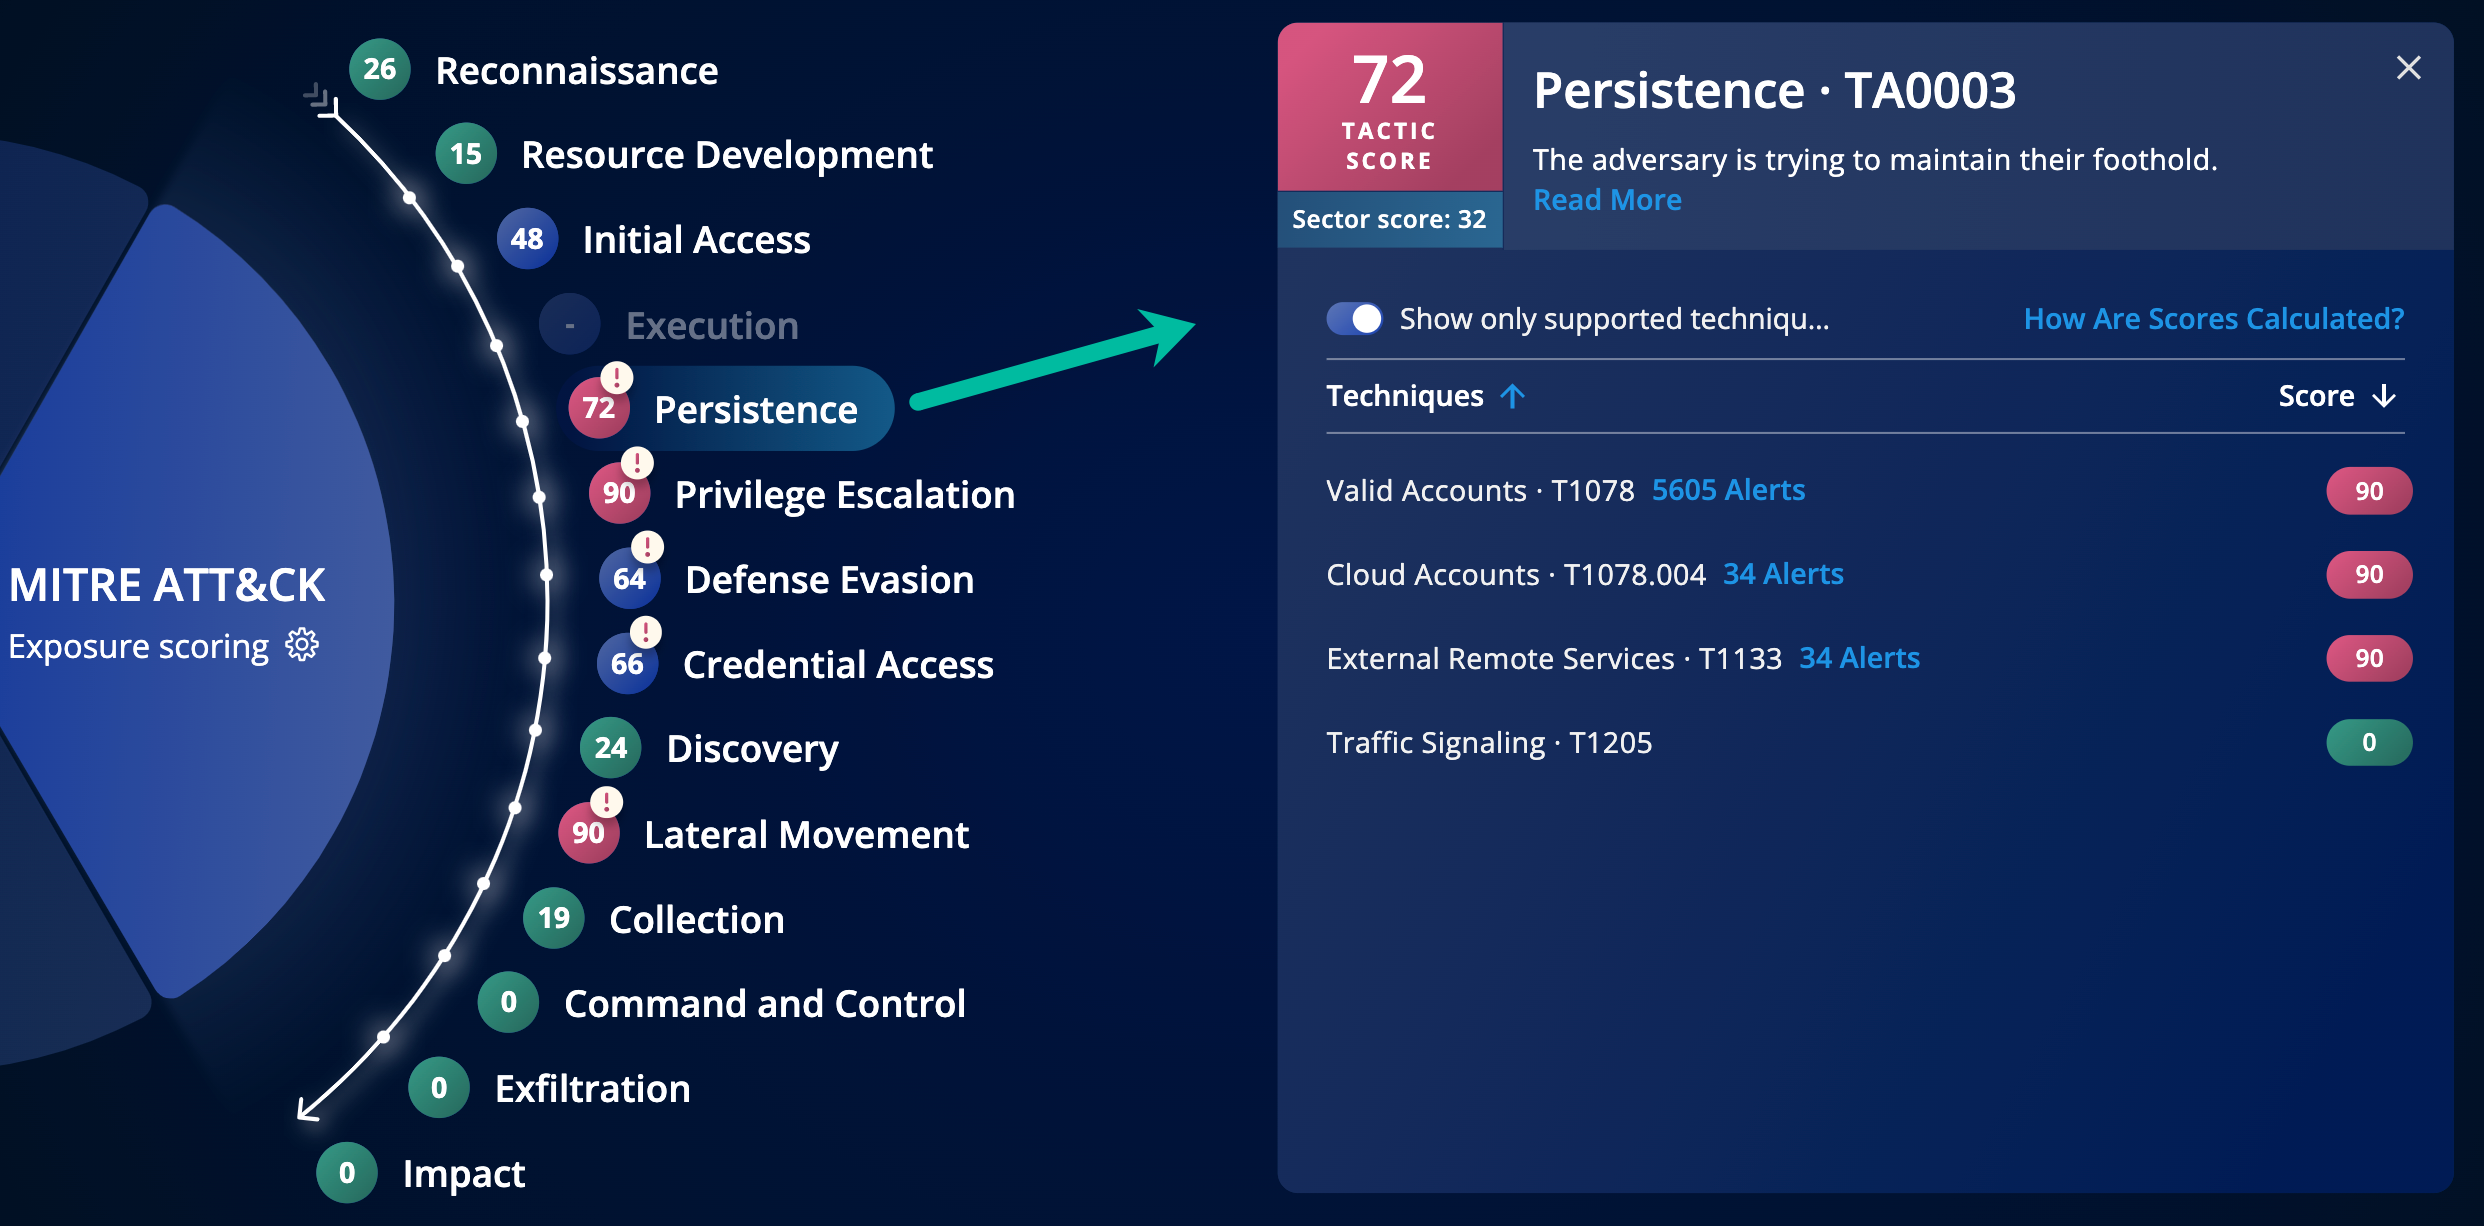
Each technique within the selected tactic is shown with how many alerts were reported as well as a score.
For more information about the score calculation, see Score calculations.
Tactics Over Time
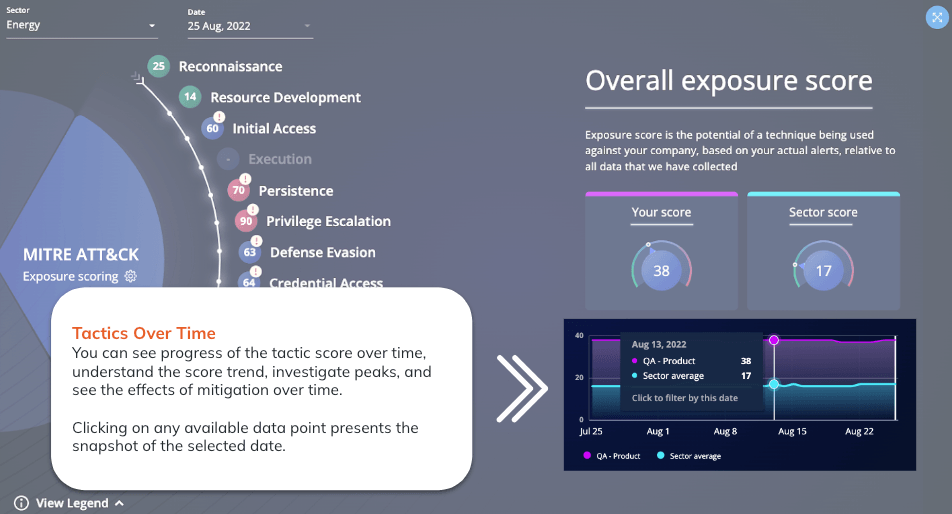
This graph shows the ups and downs of tactic risks over time. In this view, you can identify trends, peaks, and see the effects of mitigation. For example, you can compare progress over time with mitigation measures that were implemented on a certain date.
The graph shows your company score as compared to the score of the selected sector. You can compare your score to different sectors by selecting that sector in the benchmark selection area.
Benchmark selection area
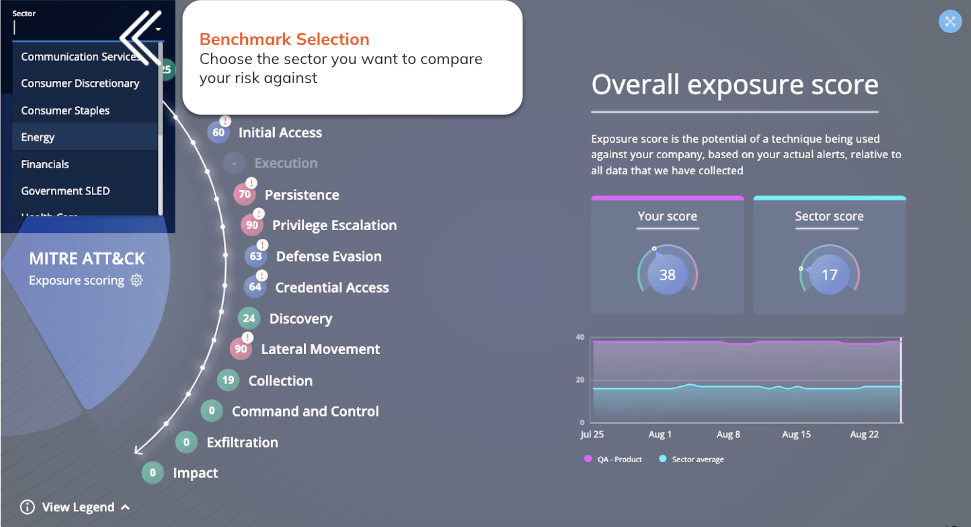
Select a sector against which to compare your risk score. See how you compare to Digital Risk Protection (Threat Command) customers in different sectors or verticals.
When you change the sector selection, the following sector-relevant dashboard data update to reflect the selection:
- The “higher than” and “lower than” indicators in the MITRE tactic score.
- The sector score of the Overall exposure.
- The sector average in the alerts over time graph.
Score calculations
- Technique score (from 0-100) - Sum of all the scenarios score mapped to the technique, relative to all the collected data from other accounts.
- Tactic score - The average of all techniques nested under the tactic.
Showcase the data
We’ve made it easy to share the data in full screen size with executives or other security decision makers.
To do this, click  .
.