Investigations
Investigations are an aggregate of the applicable alert data in a single place and are closely tied to Alerts and Detection Rules.
Types of investigations
In SIEM (InsightIDR), investigations can be created by the system or by a user.
System-created investigations
System-created investigations are automatically generated when a detection rule detects something unusual in your environment, triggering an alert. Investigations can be generated by detection rules, legacy detection rules, and basic detection rules.
SIEM (InsightIDR) adds related detections to an open, system-created investigation when:
- Detection rules trigger an investigation
- Detection rules and legacy detection rules where the rule action is set to “Create Investigations”
- Basic detection rules are configured to generate investigations
- The related detections are the same type and have the same primary actor.
Throttling for detection rules
If a detection rule triggers a large quantity of detections in a small time frame, SIEM (InsightIDR) will restrict the number of alerts and investigations created. These limits differ between detection rules and legacy UBA detection rules.
Detection Rules
The total number of alerts sent to investigations are restricted according to these limits:
- 20 alerts per asset, per minute
- 500 alerts per organization, per minute
Legacy UBA detection rules
Legacy rules do not create alerts, only investigations. The number of investigations created are restricted according to this limit:
- 50 investigations per legacy rule, per 5-minute window
The throttle resets every five minutes, meaning you may see up to 100 investigations within a 5-minute period if the investigations fall into two separate 5-minute windows.
View examples of throttling for legacy UBA rules
In this scenario, the number of investigations are throttled after 50 investigations have been created.
| Legacy rule detections | Investigations created by SIEM (InsightIDR) |
|---|---|
| 10:20 AM created 25 Third Party Alert investigations | 25 investigations created |
| 10:22 AM created 20 Third Party Alert investigations | 20 investigations created |
| 10:23 AM created 10 Third Party Alert investigations | Only 5 investigations created, the remainder is throttled |
| 10:24 AM created 5 Third Party Alert investigations | 0 investigations created |
In this scenario, investigations are not throttled because only 50 investigations are created per each 5-minute interval.
| Legacy rule detections | Investigations created by SIEM (InsightIDR) |
|---|---|
| 10:19 AM created 50 Third Party Alert investigations | 50 investigations created |
| 10:20 AM created 50 Third Party Alert investigations | 50 investigations created |
Sometimes investigations and alerts are automatically generated, but are later deemed unnecessary or outdated. This can create unwanted noise in your environment. If this happens, you can control the investigations and alerts that are automatically generated by SIEM (InsightIDR)‘s detection rules by modifying the detection rule action or for legacy rules, updating the legacy rule action.
User-created investigations
You can manually create an investigation if you would like to investigate the activity of a user or asset. To learn how to get started, visit Create an investigation.
Explore an investigation
You can view investigations in several ways, allowing you to get the context you need to effectively prioritize, sort, and respond to an incident.
Investigations
The main Investigations page provides you with an overview of all investigations, both system-created and user-created, which are displayed in order of priority.
This view can be refined even further by using the filters. You can filter investigations by:
- Date Range - The date that the investigation was created. The default selection is 28 days.
- Investigation Category - Filter for investigations that are managed by the Rapid7 MDR SOC or are custom and contextual investigations.
- Priority - The priority assigned to the investigation, based on the impact and urgency of the detections and assets associated with it. The options are Critical, High, Medium, and Low.
- Status - Indicates where the investigation is in the triage process. The options are Open, Investigating, Waiting, and Closed.
- Detection Rule - The detection rule that created the investigation.
- MITRE ATT&CK Coverage - The MITRE ATT&CK tactic associated with the detection rule that created the investigation.
- Investigation Type - Indicates how the investigation was created. The options are User, Detection Rule, Scheduled Endpoint Queries, and Automation.
- Assignee - The user who is assigned to the investigation.
Search your investigations
You can search for specific investigations using the search field. This field allows you to search using:
- Investigation names
- Users associated with the investigation
- Assets that might be found within an investigation
View linked assets and users
Investigations often have actors, assets or users, associated with them. From the main Investigations page, you can view high-level asset and user information by expanding an investigation card. For a more detailed view, click into an investigation.
To view the assets and users of an investigation:
- Select an investigation.
- Select the arrow dropdown on the far right of the investigations card.
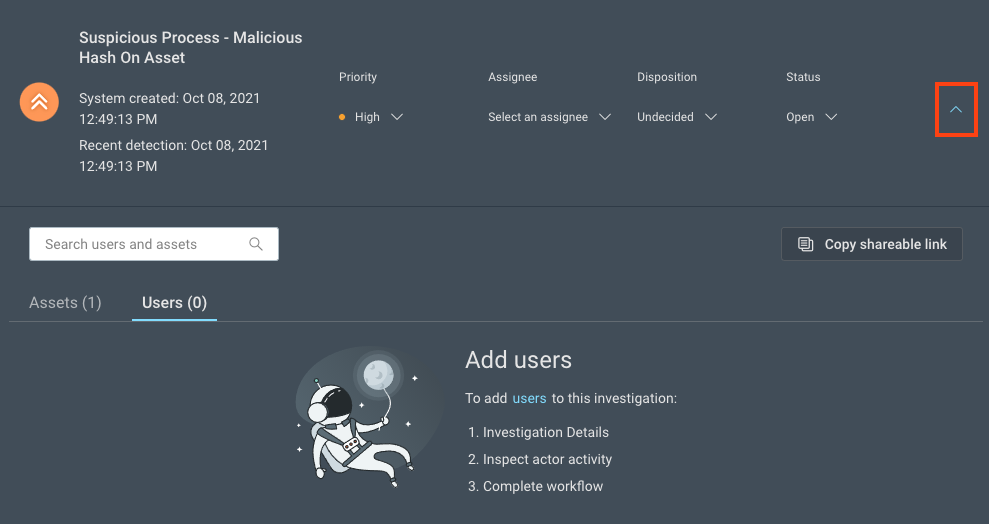
- Use the tabs provided to view all linked assets or users, or use search to find a specific user or asset.
Investigation details
To view the Investigations Details page, select any investigation. From this page, you can examine the finer details, such as the activity that triggered the creation of the investigation and a timeline of events.
You can also explore the contextual data and take actions on your investigation.
At the top of the page, the main investigation details card is displayed. For user-created investigations, the details shown are:
- The name of the investigation
- The date it was created
- The date and time it was last accessed
- The most recent detection
- The status, priority, assignee, and disposition
For system-created investigations, the investigation name is generated by the detection rule that triggered it.
Learn more about updating the primary investigation attributes, such as the status, priority, assignee, and disposition.
Timeline view
From the Investigation Details page, you can view all of the activity and information related to the investigation in the form of a timeline or a table, including the users and assets that are involved.
Guide to timeline icons and options
An investigation timeline can include a variety of events, with each type represented by a unique icon. Here is a list of the icons and what they represent:
| Icon | Meaning |
|---|---|
| Alert | |
| Notable behavior | |
| Logs | |
| Workflow | |
| Endpoint queries | |
| Notes | |
| User | |
| Asset | |
| Automation workflow |
Alerts in investigations
In the timeline and table, SIEM (InsightIDR) provides extra details and actions for the alert event type, which allows you to gain helpful context during the investigation process.
To view more about alert information, view the Anatomy of an alert help page.
Remove an alert
Select the Remove Alert button to disassociate the alert from the investigation. Removing an alert from an investigation does not delete it from SIEM (InsightIDR).
Audit logs
No data displaying in the audit log?
To view the audit logs, you need access to the SIEM (InsightIDR) Investigations and SIEM (InsightIDR) Alerts logs. Read more about managing access to logs and log sets in the Command Platform (Insight Platform) documentation. Contact your Platform Administrator for questions about your permissions.
The audit log is a detailed chronological view of every action taken in relation to a particular object. It can help contribute to strengthened security reporting and compliance within your organization.
The additional benefits of using an audit log include improved team collaboration, the ability to analyze user activity and their response time during security breaches, recommending new security procedures, and providing legal evidence.
SIEM (InsightIDR) has two audit logs, one for investigations and one for alerts.
Investigations audit log
The investigations audit log collects data about all of the updates to an investigation, when they were made, and by which user. From the audit log panel, you can filter your view to focus on any of the information you are looking for, such as:
- Any changes to the disposition, priority, assignee, or status
- The endpoint queries that were run
- Any comments and attachments that were added
To view and download the investigations audit log:
- From the left menu, go to Investigations.
- Select an investigation.
- Click Audit Log.
- In the Audit Log panel, set the date range for the updates that you want to view.
- Optionally, select filters to streamline your view of the updates.
- To save the audit log locally, click the Download button. The downloaded log contains the updates that occurred within the selected date range only.
To query the investigations audit log in Log Search:
- From the left menu, go to Log Search.
- Select the Audit Logs log set with the SIEM (InsightIDR) Investigations log. Read about Event Types and Keys to understand which keys are available to use in your query.
Alerts audit log
The alerts audit log captures data about all of the updates to an alert, when they were made, and by whom.
To view an alert’s audit log:
- From the left menu, go to Investigations.
- Select an investigation.
- Select the Alert Details button for the alert with the audit log you want to view.
- Click the Audit Log tab.
- On the left, apply filters to locate the audit log entries that you want to view.
- On the right, expand each audit log entry to view its details.
To query the alert audit log in Log Search:
- From the left menu, go to Log Search.
- Select the Audit Logs log set with the SIEM (InsightIDR) Alerts log. Read about Event Types and Keys to understand which keys are available to use in your query.
Managed investigations for MDR only
If you are a Managed Detection and Response (MDR) customer, you can view the Rapid7 Managed tag in our Investigations experience to determine which investigations are managed by our MDR SOC team.