This product is no longer sold. We no longer update these help pages, so some information may be out of date.
Log Management (InsightOps) Homepage
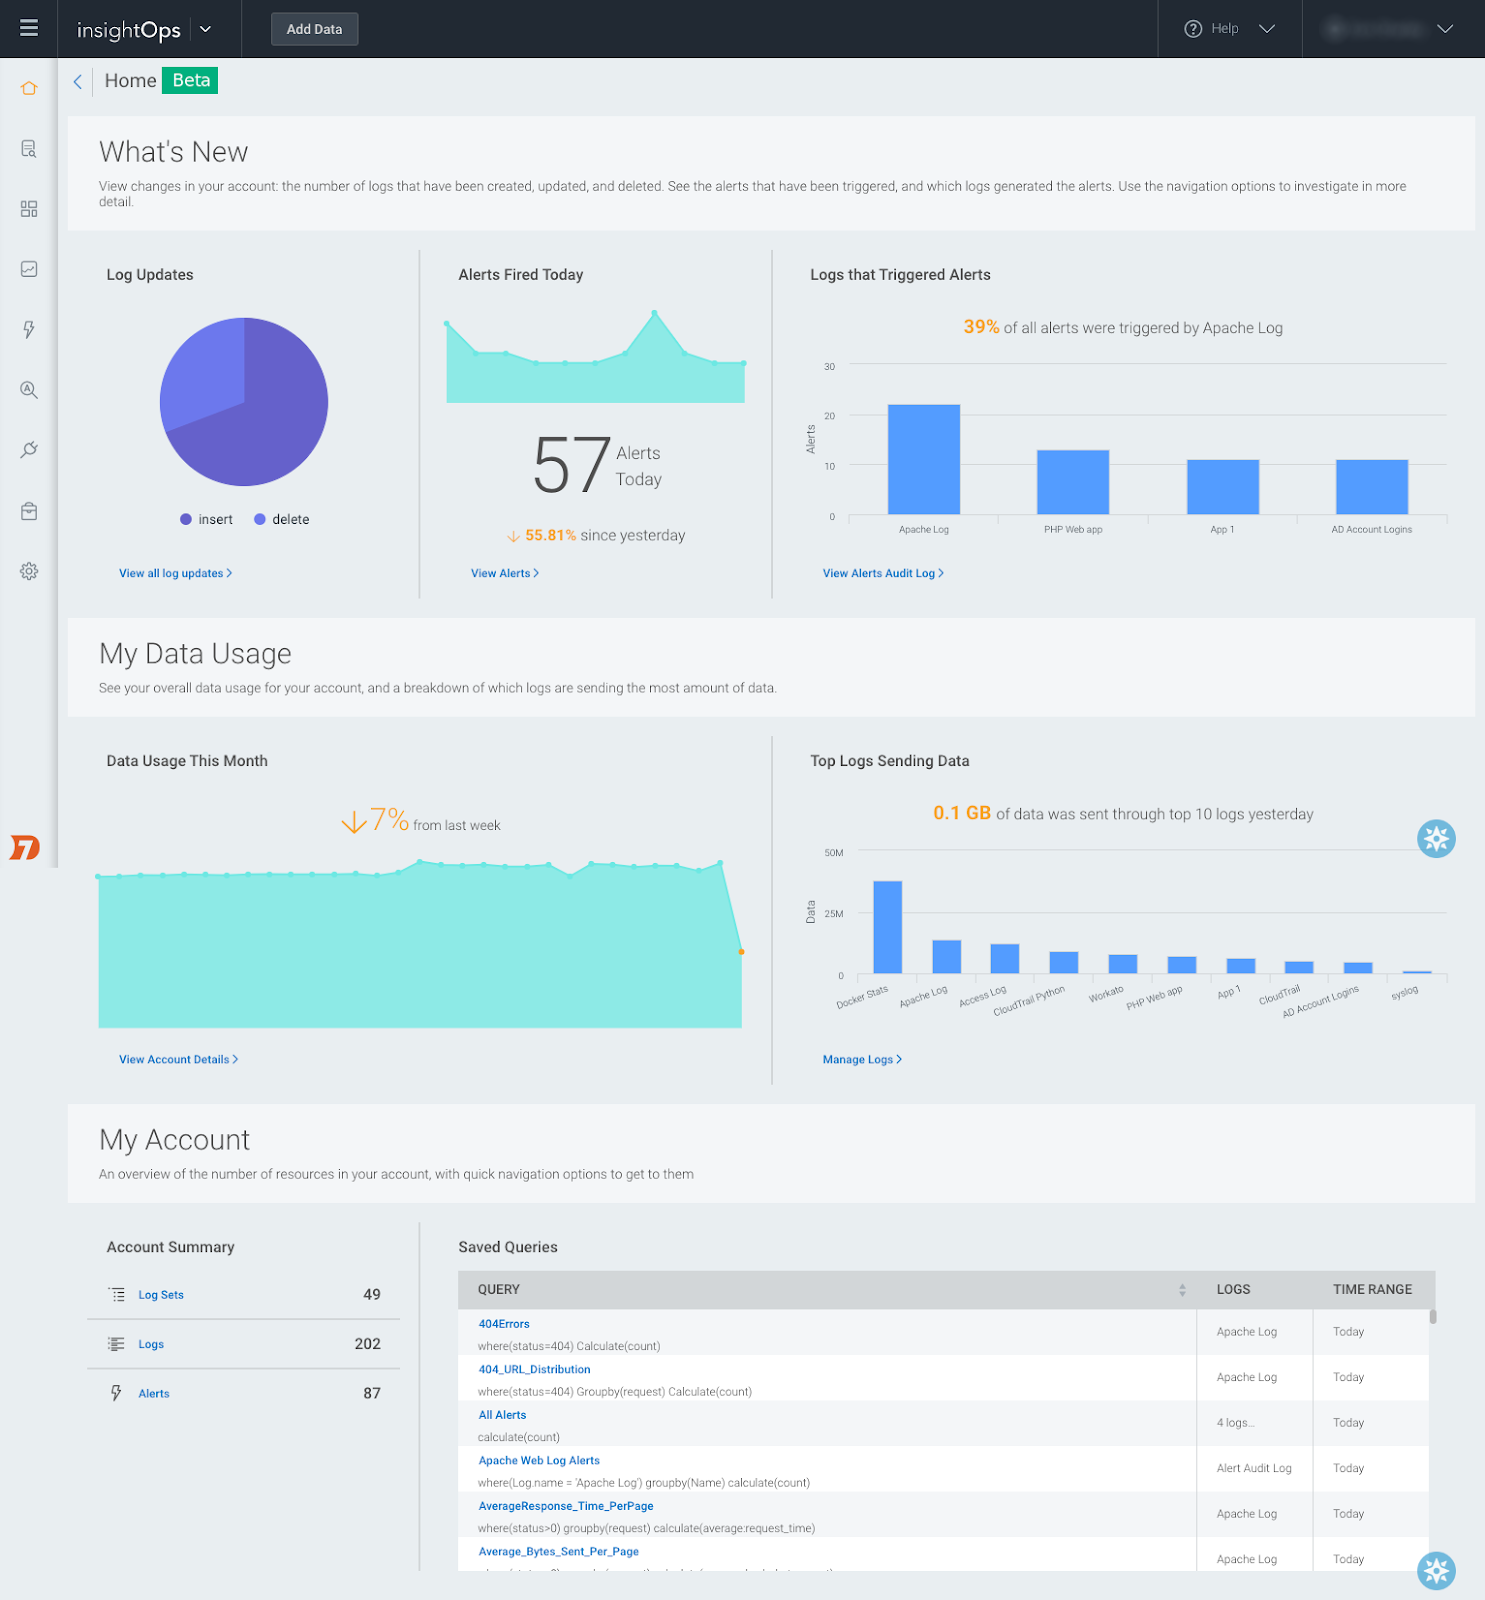
The Log Management (InsightOps) Homepage gathers information about your account in a visual dashboard. Each of these interactive dashboards link to relevant pages so you can see more granular information.
From the Homepage, you can see visual data in one of three sections:
What’s New?
The “What’s New?” section provides dashboards for logs that were created, updated, or deleted recently. You can also see alerts triggered on the current day and what percent that number has changed since the day before. Additionally, you can see which logs triggered the most amount of alerts.
Click on the dashboard links to see additional information:
- Log Updates displays the Log Updates audit log
- Alerts brings you to the “Manage Alerts” page
- Alerts Audit Log displays the Alerts Audit Log
My Data Usage
The “My Data Usage” section provides dashboards for data usage from the current month and a comparison of data usage from the previous week. You can also see which ten logs are sending the most data to Log Management (InsightOps).
Click on the dashboard links to see additional information:
- Account Details brings you to the “Plan Details” tab from the “Settings” page
- Manage Logs brings you to the “Log Stream” tab from the “Data Collection” page
My Account
The “My Account” section utilizes the “Account Summary” to display the number of log sets, logs, and alerts in your account. You can use the table of Saved Queries associated with your logs, which you can sort alphabetically.
Click on the dashboard links to see additional information:
- Log Sets brings you to the “Log Stream” tab from the “Data Collection” page
- Logs brings you to the “Log Stream” tab from the “Data Collection” page
- Alerts brings you to the “Manage Alerts” page