Cards
Overview
Vulnerability Management (InsightVM) features a substantial number of specialized widgets that you can use to monitor network data, almost all of which are interactive. Available functions differ by the type of widget being used.
Data types
Explore the widget library to gain visibility on the following metrics affecting your network:
- Agents
- Assets
- Containers
- Key Performance Indicators (KPI)
- Remediations
- Risk
- Sites
- Vulnerabilities, both in general and specific to high-profile exploits
Presentation types
Widgets display their data in several different ways. The following types are among the most common:
Pie chart
Pie charts show data subdivided by category. Each section displays details on mouseover. Click any section to isolate its data in tabular form.
Table
Click available column headers to toggle record sorting by ascending or descending order. Additionally, click the “Name” link of any row to see a detail page for that particular item.
Number
These widgets reduce their data to a single number. Many can be refined with options provided in a dropdown menu.
Stacked area
Stacked area widgets function as multi-layered line graphs. Use these widgets to compare changes across several metrics over a time period you specify.
TIP
The following presentation types are also available:
- Scatter plot
- Column
- Solid gauge
- Timeline
- Line
- Tree map
- Heat map
Feel free to experiment with any and all widget types.
Expanded views
The majority of widgets offered through Vulnerability Management (InsightVM) are comprised of individual asset and vulnerability records. These expandable widgets contain additional details and features.
Browse to an applicable widget and click Expand Widget >.
Expanded widgets offer the following capabilities:
- Query creation - see Query Builder to learn more about this feature.
- Remediation project creation - see Remediation Projects to learn more about this feature.
- Sortable data tables
- Links to asset or vulnerability detail pages
- CSV export options
Widget data tables
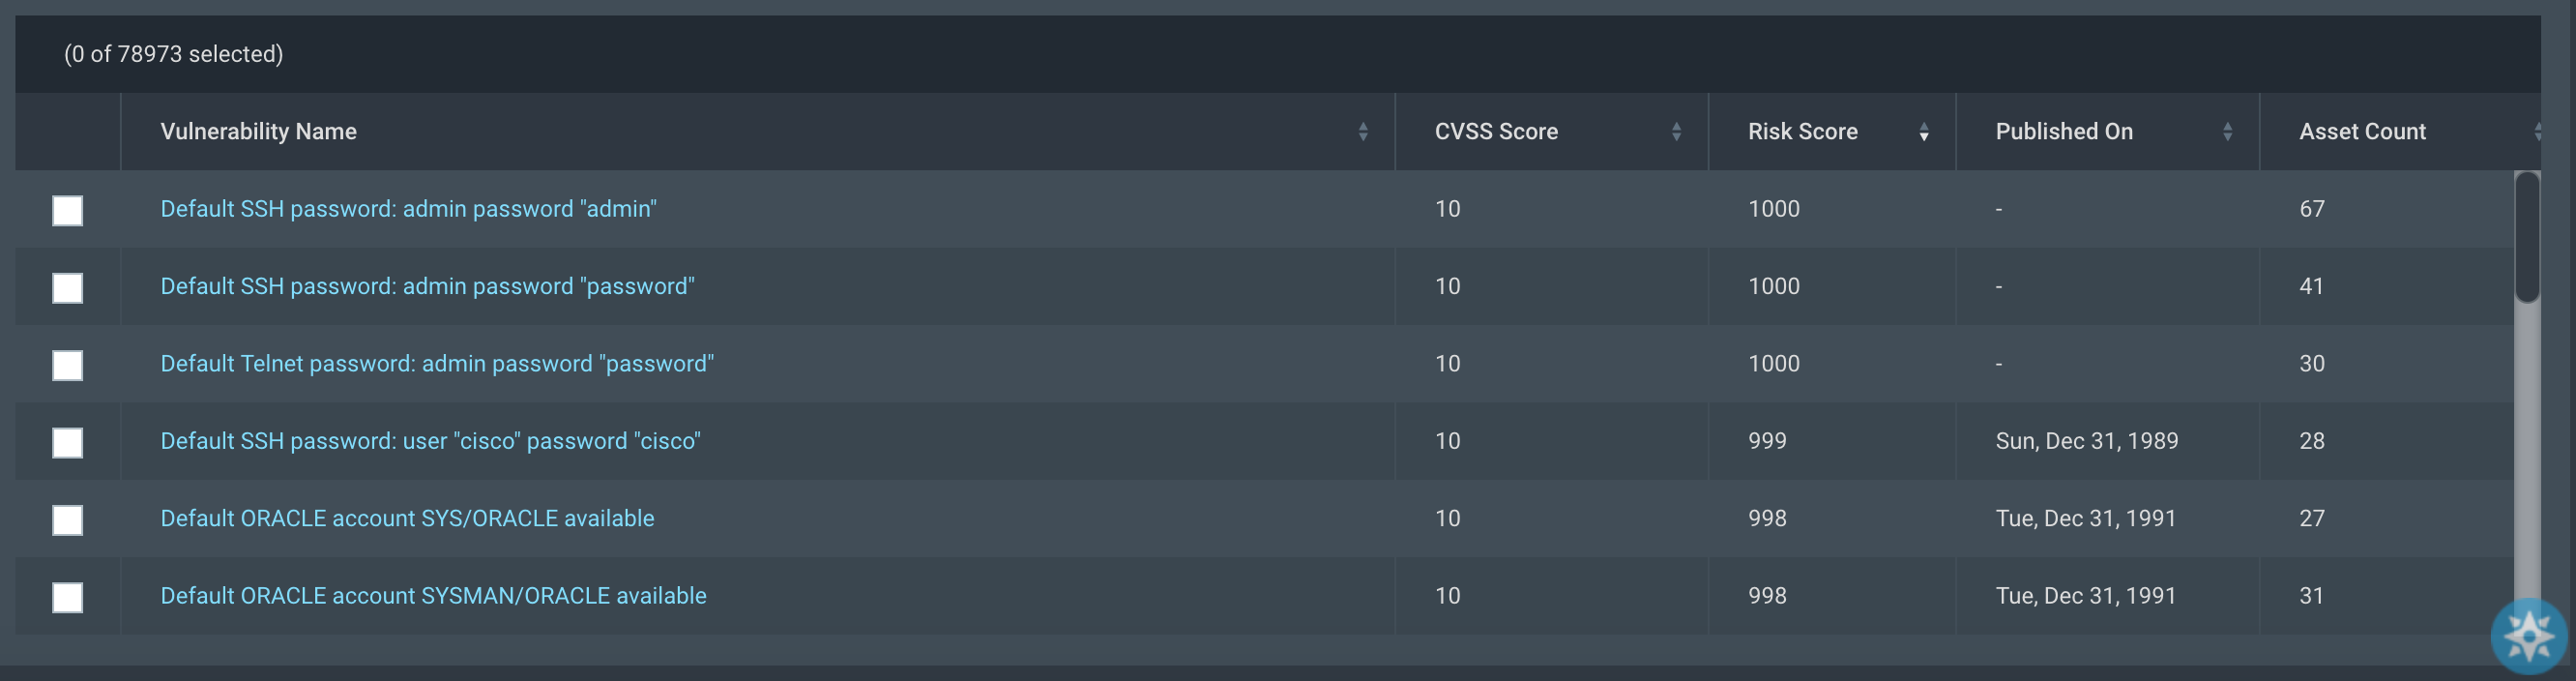
Use the tables in expanded widget to examine individual vulnerability or asset records. These records are also sortable by column, and clicking any “Name” link will take you to a detail page for that record.
You can manage the data visible on the table by clicking Manage Columns and show or hide the columns as required.
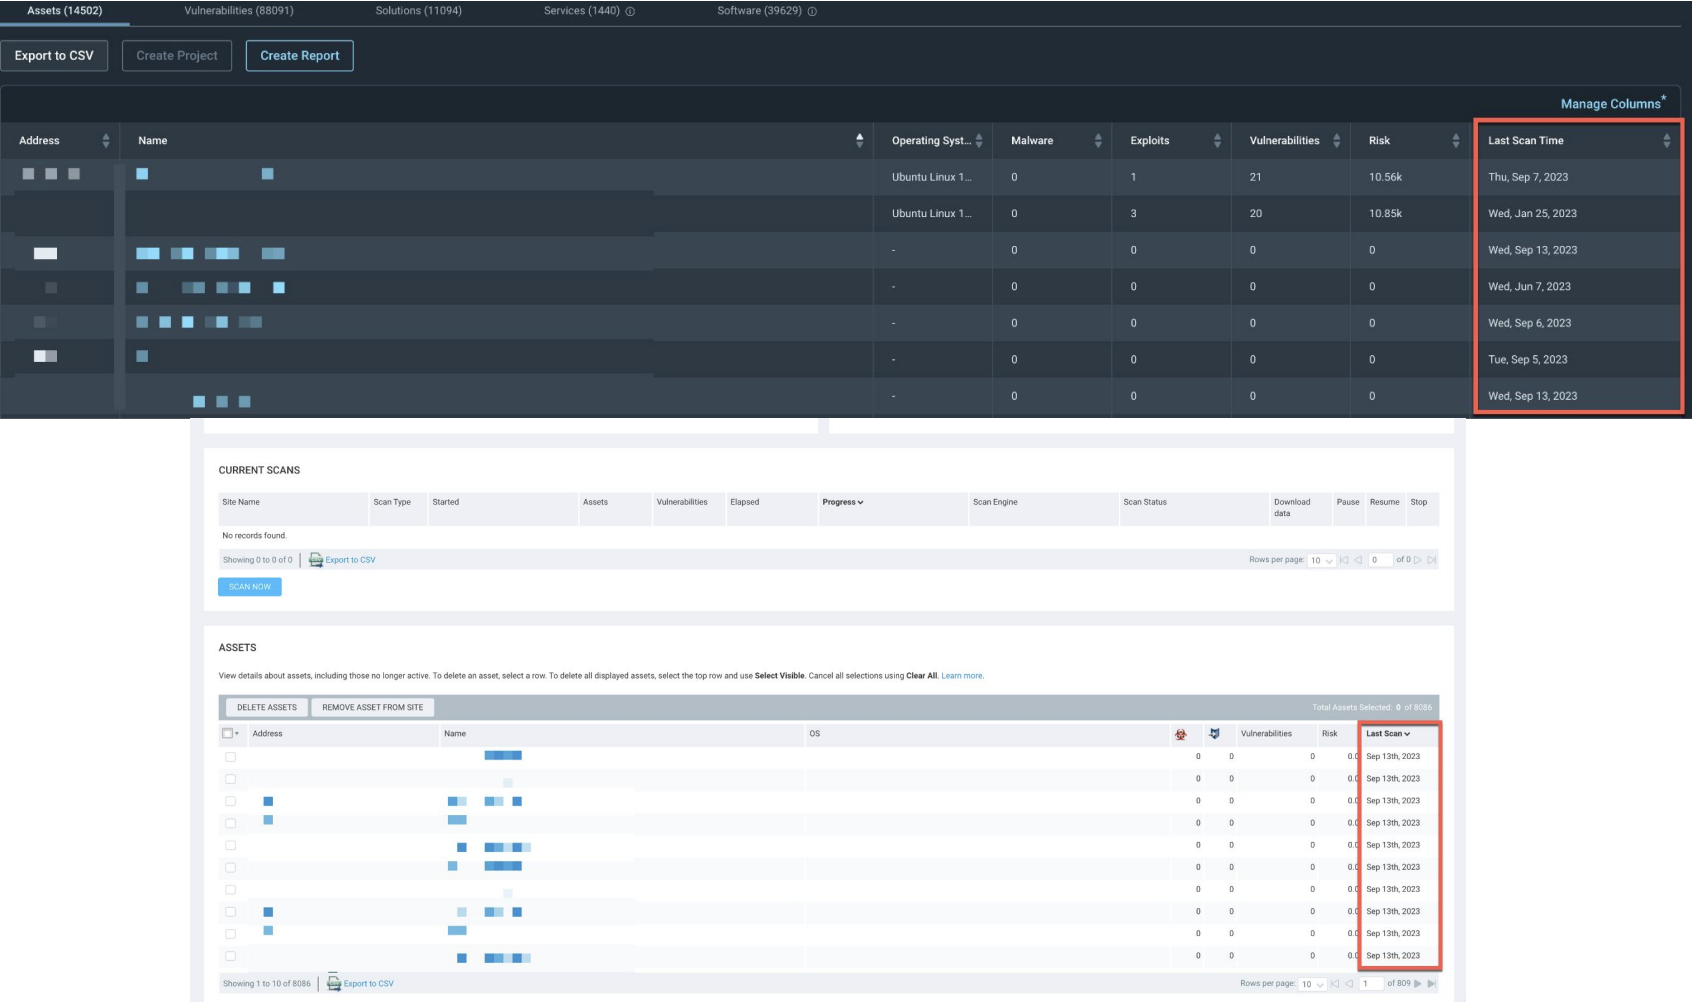
Last Scan Time compared to Last Scan
The Last Scan Time column available in the Query Builder specifically refers to the last time an asset was assessed by the Rapid7 Agent (Insight Agent). The Last Scan seen on the Sites detail page or Assets refers to the last time a discovery, vulnerability, or policy scan was run.
Open detail drawers
Click anywhere within a table row to open a detail drawer for that record. Detail drawers provide quick looks at further record information without navigating away from the table itself.
Export to CSV
Use the checkboxes next to individual records to select rows for CSV export. The Export dropdown will activate when at least one row has been selected.