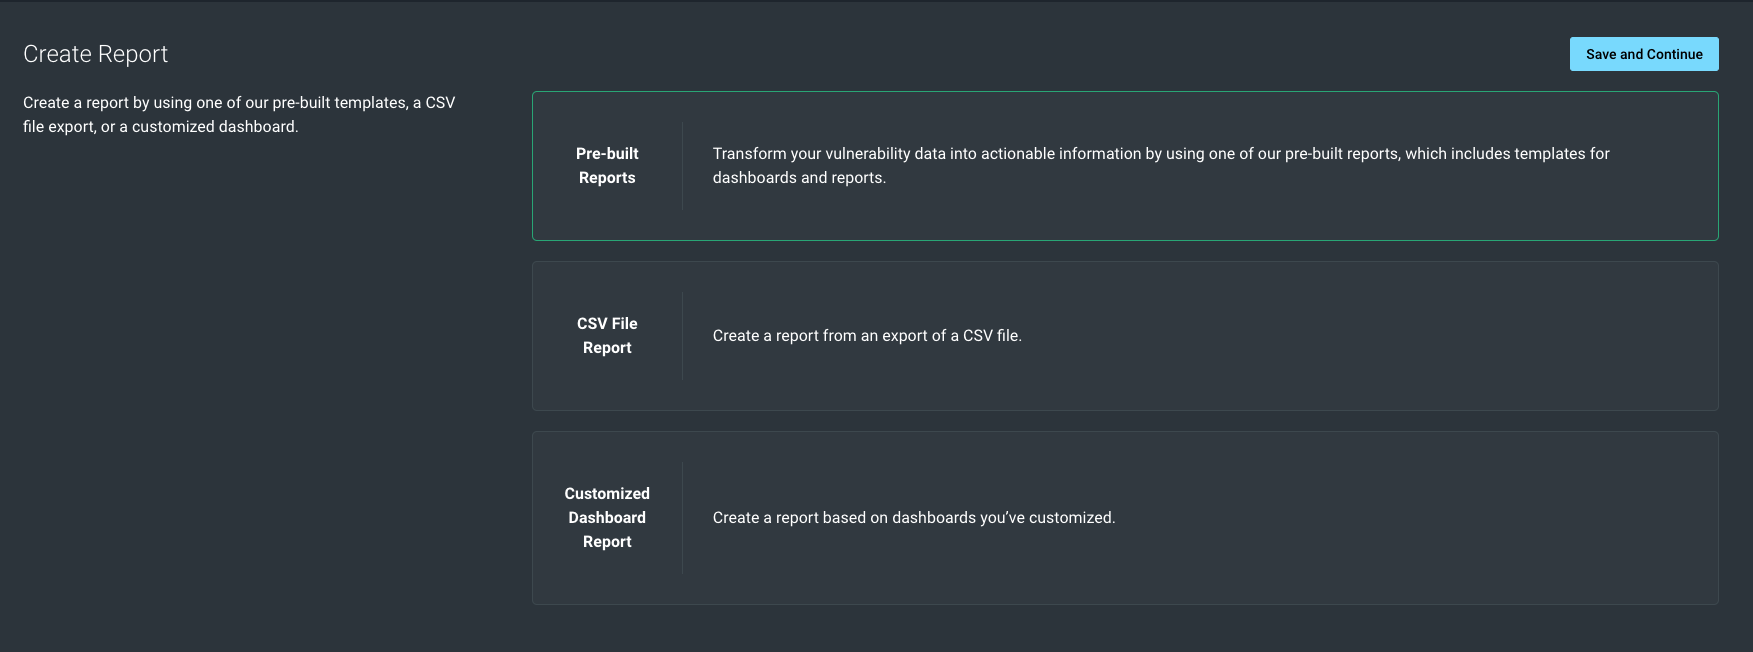
Report Creation Wizard
Collect, analyze, and report Vulnerability Management (InsightVM) data all in one place using the Report Creation Wizard in Query Builder. You can share directly with stakeholders to help you communicate about your work and gain insight into your organization’s vulnerability management program.
In order to perform these tasks, you need to create queries and dashboards.
Access the report wizard
- After logging into Vulnerability Management (InsightVM), open Query Builder.
- Load or Add a query to set the scope of your report (optional)
- Click Create Report to open our wizard.
- Select the report type you want to build. The wizard will guide you through the process of creating a customized report in 4 steps.
I want to
Export to CSV
You can export a CSV file to manipulate in-depth raw data in your favorite spreadsheet program.
What's the difference between Export to CSV and a CSV File Report?
Export to CSV generates an ad-hoc export of your data. If you want to schedule this export to run periodically, click Create Report and select CSV File Report in the first step of the wizard. Follow the wizard’s instructions for the remaining steps.
We’ll examine this use case:
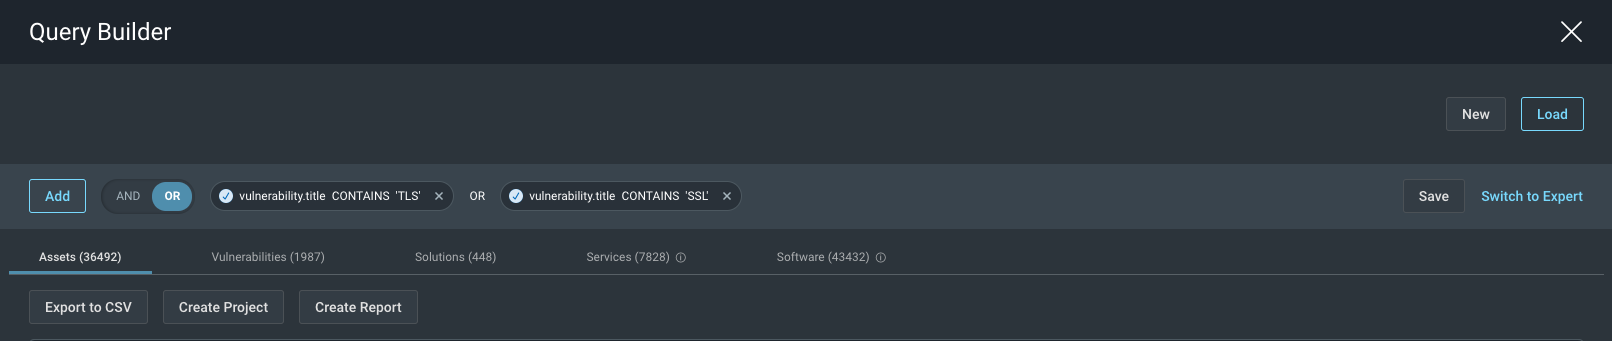
Create a report for all assets that contain TLS and SSL vulnerabilities.
To do so, you’ll need to build 2 queries.
Build a query for to identify TLS vulnerabilities
- Open Query Builder.
- Click Add.
- Type “vulnerability” in the search box and select vulnerability.title.
- Select CONTAINS.
- Type “TLS”.
- Click Apply.
Before building the 2nd query, toggle to OR.
Build a query for all SSL vulnerabilities
- Click Add.
- Type vulnerability in the search box and select vulnerability.title.
- Select CONTAINS.
- Type “SSL”.
- Click Apply.
- Click Export to CSV.
Here’s what the queries will look like:
Export vulnerabilities or assets
When you are on the Assets tab, clicking Export to CSV will export your assets data. If you want to export vulnerabilities data, click on the Vulnerabilities tab first, then click Export to CSV.
Use a Dashboard Template to export a PDF
This option allows you to create a printable PDF report from a dashboard template provided by Rapid7 without the need of creating a dashboard. It also allows you to apply a query to set the scope of the PDF report.
To generate these types of reports:
- After logging into Vulnerability Management (InsightVM), open Query Builder.
- Optional: Add a query to scope your data.
- Click Create Report to open the wizard.
- Select the report type you want to build. You’ll be guided through the process of creating a customized report in 4 steps.
Use a Customized Dashboard to export a PDF
- Click the Dashboards icon in the left hand navigation.
- Find the dashboard you want to customize from the drop down menu.
- Click View.
- Click Export to PDF.
Share a report with external stakeholders
You can send PDF reports by email with stakeholders who are not Vulnerability Management (InsightVM) users. The PDF sent is encrypted and password-protected as an additional security measure. Recipients will receive two e-mails:
- An e-mail with the generated report as a PDF
- An e-mail with the password to open the PDF
Email a PDF report to external stakeholders
- In Vulnerability Management (InsightVM), go to Query Builder.
- (Optional) Set report scope by loading or building a query.
- Click Create Report.
- Select PDF as the report type.
- Select the report template.
- In Shared With, select Permit users who do not have access to console, and enter the email addresses.
- Click Save and Complete.
Schedule report creation
To schedule this export to automatically occur periodically, you need to use the Report Creation Wizard in Query Builder. In Query Builder, you can optionally create a query and then click Create Report to go to the wizard. In the first step, select Custom Dashboard Template and follow the steps.
Example: Export custom Patch Tuesday dashboards to PDF
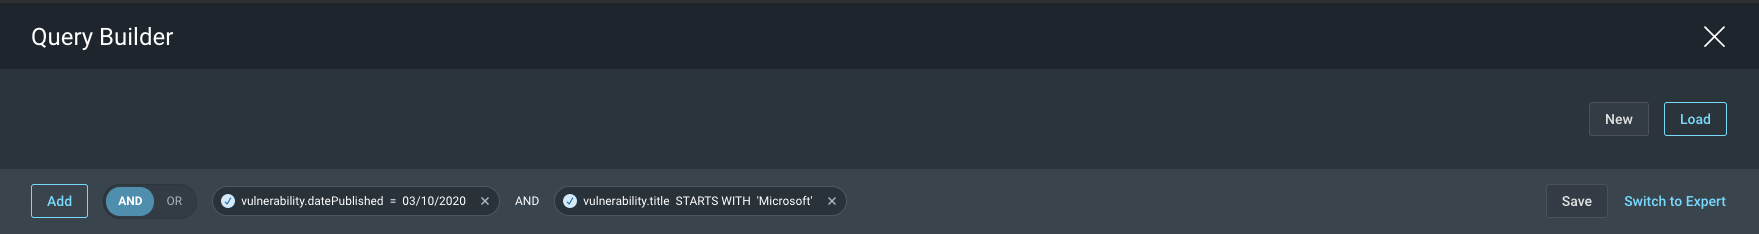
I want to see our exposure to Patch Tuesday vulnerabilities starting on March 10, 2020, create a remediation plan, and report our progress.
Build Queries in Query Builder
To accomplish this, you’ll need to build 2 queries in Query Builder. The 1st query will find the vulnerabilities published on March 10, 2020.
- Open Query Builder.
- Click Add.
- Type “vulnerability” in the search box and select vulnerability.datePublished.
- Select =.
- Type “03/10/2020”.
- Click Apply.
The second query will find the Microsoft-related vulnerabilities. Before starting, confirm that the toggle is set to AND.
- Click Add.
- Type vulnerability in the search box and select vulnerability.title.
- Select Starts With.
- Type “Microsoft”.
- Click Apply.
Optional: Save this query
Click Save so you can reuse this query for future use with our other features, such as Dashboards, Goals and SLAs, and Remediation Projects.
Here’s what your queries will look like:
Build and populate a new dashboard with widgets
First, you’ll have to create a new dashboard, then add new widgets to it.
Create a dashboard:
- Click the Dashboard icon in the left menu to navigate to the Dashboards main page.
- In the dropdown menu at the top, select CREATE A NEW DASHBOARD.
- Enter in a name and description for your new dashboard.
- Click OK. You’ll be taken to your new dashboard where you can now add widgets to it.
Next, you’ll add widgets to your dashboard:
- Click + Add Widget.
- Search for the Total Asset Trends widget. Check the box and click Add.
- After the Total Asset Trends widget is in your dashboard, click Expand Widget >.
- Click Load.
- Select your Patch Tuesday query to load it onto the dashboard widget.
- Click Save Widget.
This widget will display the total number of assets affected by the vulnerabilities that meet the query you created earlier.
Query drill down on dashboard widgets
Queries applied to dashboard widgets will filter the data according to that query.
Repeat Steps 1- 6, to build widgets for: Number of Vulnerabilities: Displays all of the vulnerability findings found on Patch Tuesday (03/10/2020) New vs Remediated Vulnerabilities Over Time: Displays all vulnerability findings for that Patch Tuesday (03/10/2020) and how well they are remediated over time.
Optional: Add more widgets around this use case
Feel free to add other widgets you would like to see around this use case. For example, the Most Common Solutions widget could be useful to show all solutions to be applied to remediate all vulnerabilities in your environment.
Optional: Create a goal and remediation project to maximize vulnerability management efforts
Using this particular scope, you can build a time-bound goal to track remediation efforts. After creating a goal, you can add a goal widget to the dashboard you just created to keep an eye on progress.
You can assign a user to execute remediation for the specified assets and update the status by creating a remediation project through a Jira or ServiceNow ticketing integration. Create a remediation project directly from Query Builder or from the goal you created above with the Patch Tuesday query you created in Step 1.
Once you’ve created your widget, select your dashboard from the dashboard menu and click Export to PDF.