Rapid7 Network Sensor (Insight Network Sensor) Troubleshooting
This troubleshooting guide is to be used if one or more of your Insight Network Sensors are reporting an error or if you have deployed a sensor and you are not getting any data into log search. You will need admin access to your SIEM (InsightIDR) instance and shell or SSH access to the sensor host to perform these troubleshooting steps.
Check Sensor Management
If the sensor you are working on is not shown in sensor management, it is not sending a beacon to the platform. This usually indicates a communication issue where the sensor cannot establish an outbound connection to endpoint.ingress.rapid7.com over TCP port 443. Ensure that you have enabled an outbound rule on your firewall(s) to allow this communication.
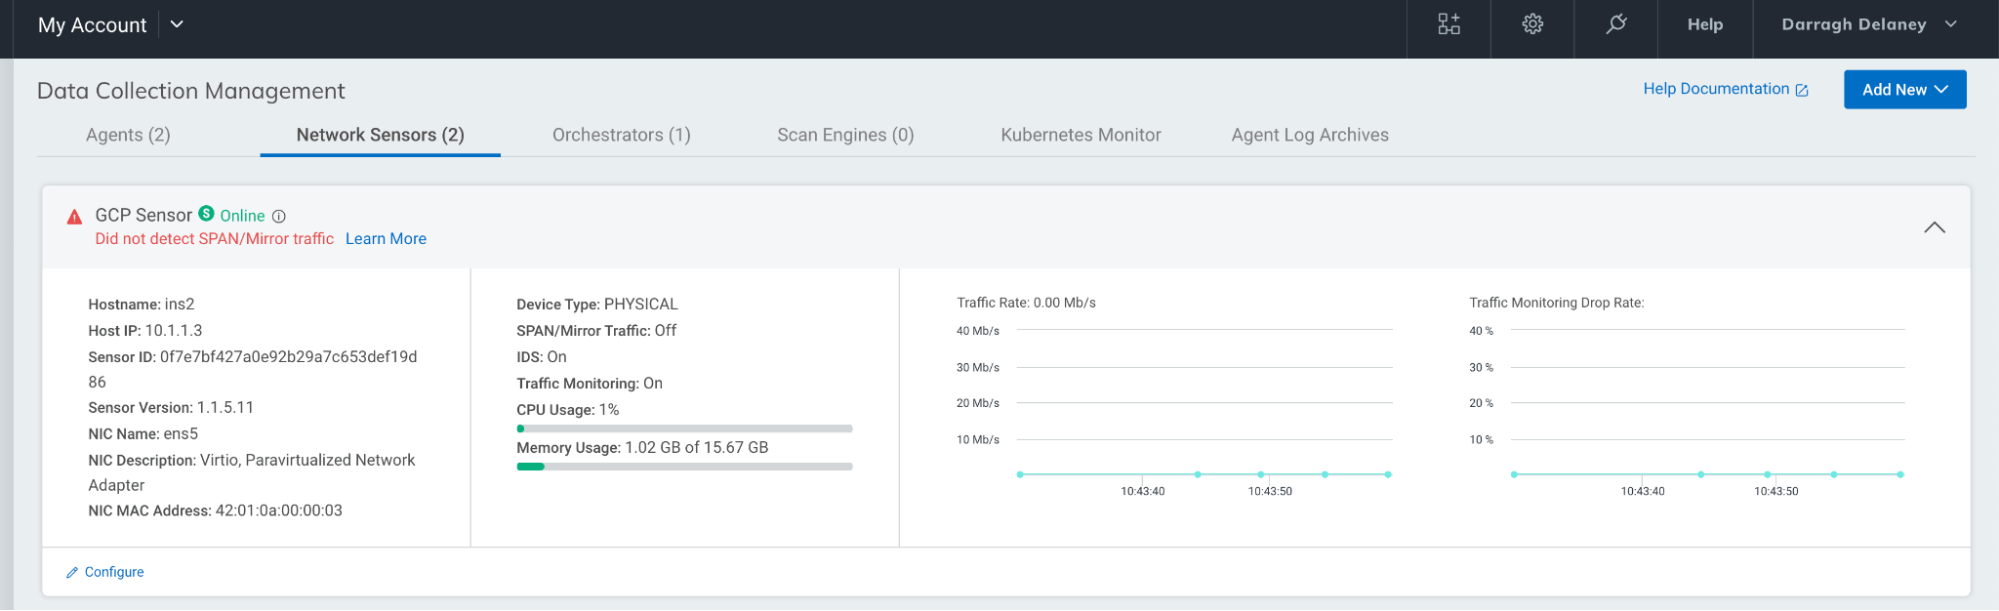
If a sensor is present but not delivering data, review any error messages. Most common would be:
- No SPAN traffic. Please review configure your network traffic source
- Incompatible CPU. Please review these requirements
- Only one NIC detected. Please review these requirements
Sensor Troubleshooting via Command Shell
NIC Issues
An Rapid7 Network Sensor (Insight Network Sensor) needs two network interfaces to function. One for management and one for network traffic capture. Interfaces need to be ‘UP’ to be detected. To view all the available interfaces in shell, try:
$ sudo ip addr list
An interface that is ‘down’ looks like
ens5: <BROADCAST,MULTICAST>
To bring it up: $ sudo ip link set ens5 up
So that it looks like
ens39: <BROADCAST,MULTICAST,UP,LOWER_UP>
Check if sensor is receiving traffic
Access the sensor management page and note the name of the NIC associated with the problematic sensor. For this example I will use ens5 and 10.1.1.1 as the IP address of a network device that the sensor is configured to monitor.
Run the command sudo tcpdump -i ens5 -nt host 10.1.1.1
You should observe network packets associated with the monitored host. If no traffic is observed you need to review how your network traffic source is set up.
Network sensor IDS health check
IDS Test
Try and access this URL from a system that is being monitoring by your sensor.:
http://www.rapid7.com/NetworkSensorIDSTest/
An alert will be triggered if everything is configured correctly. Note it needs to be a HTTP request and not HTTPS. You will get a page not found error but this is okay, the IDS rule will trigger on the outbound request. Access your log search interface and check if the alert(s) appear within the IDS Alert log set.
Check if sensor is delivering data to your SIEM (InsightIDR) account
If your sensors are delivering data, you should see entries for each sensor under DNS Query and/or Host To IP Observations log sets. If you have the ENTA add on or are subscribed to the Ultimate IDR package, you will also have a Network Flow logs.
When a sensor is first deployed it will take a few minutes for data to appear in log search. It is recommended to wait an hour before running queries and/or building dashboards. If you do not observe any sensor within log search, check the sensor configuration and make sure that IDS and Traffic Monitoring are enabled.
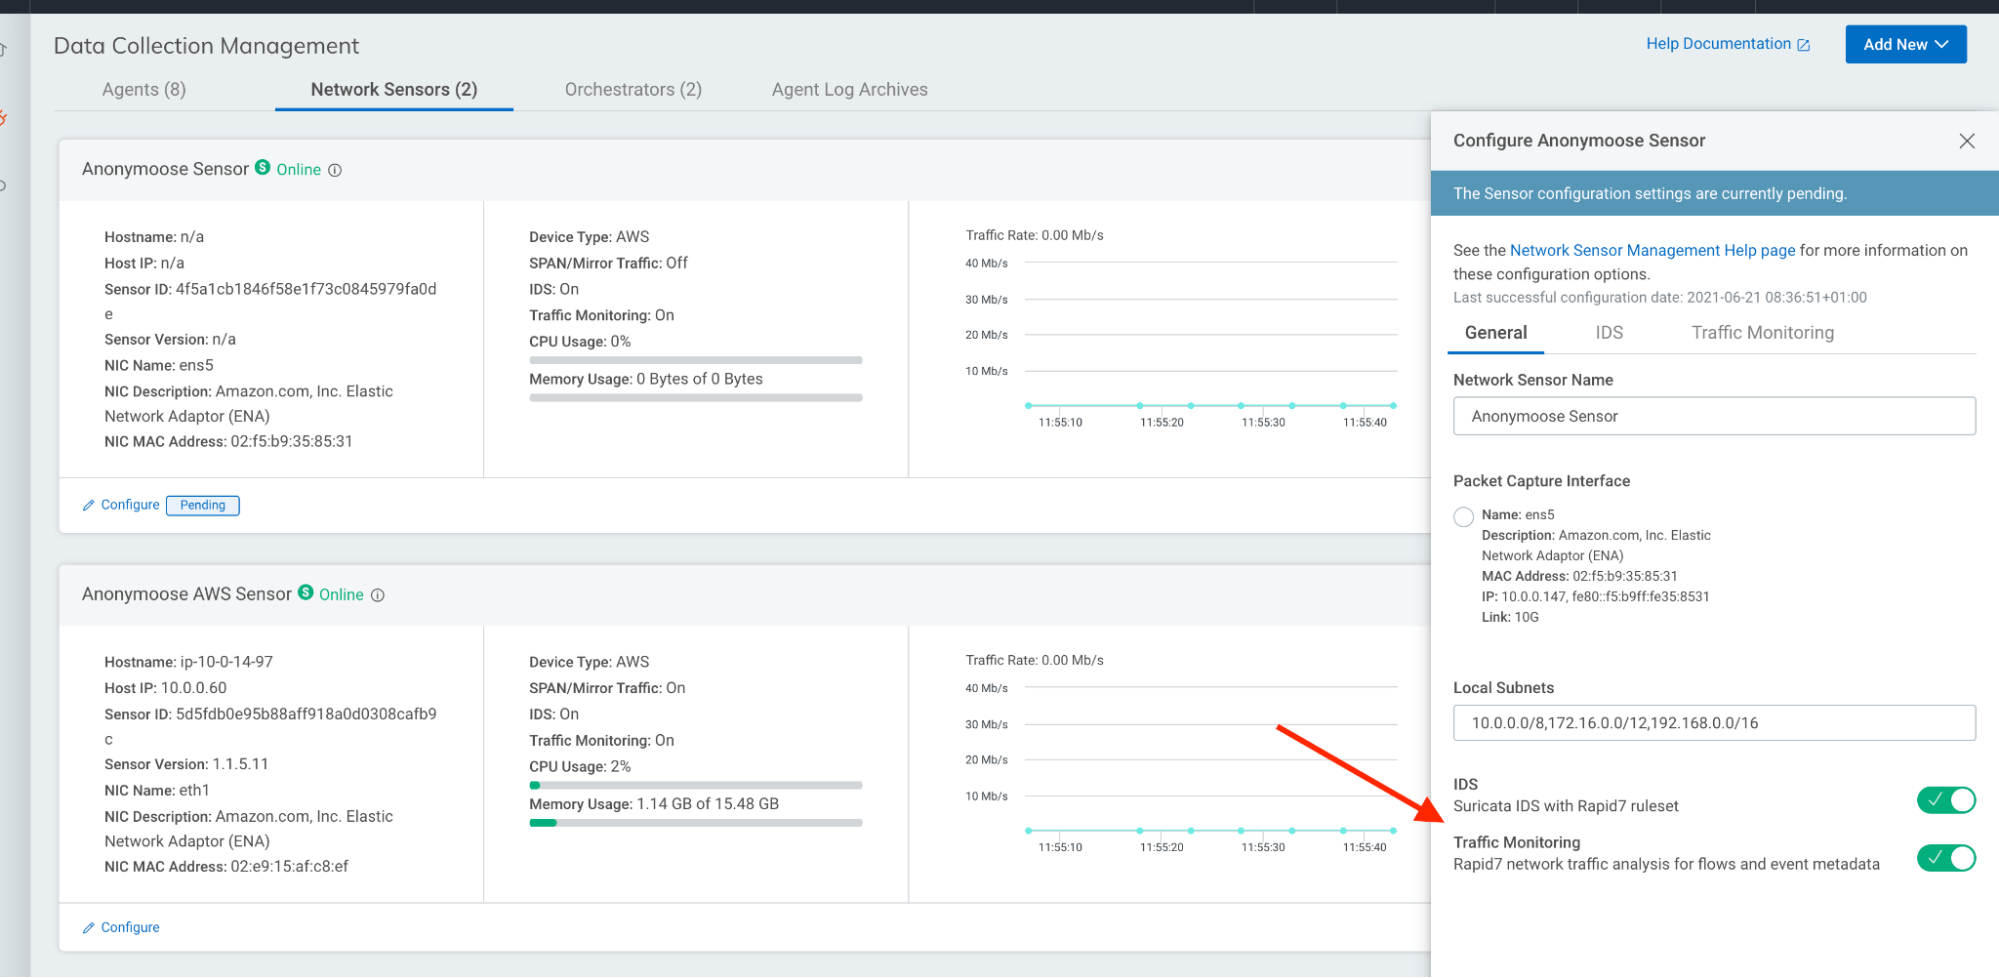
If both options are enabled and sensor data is not getting into log search go back to the Check if sensor is receiving traffic step further up in this guide.
AWS Cloud Based Sensors
The most common issues we observe with cloud based sensors is that relevant firewall rules are not added and the sensor will have issues when attempting to connect to the platform or with delivery of mirror traffic from the monitored VPC. Please review the requirements on this page
Removing a sensor from data collection management
To remove a sensor, you need to shut down the host system and/or remove sensor software. Once these steps are complete you need to leave offline for 7 days and the sensor will automatically disappear from sensor management.
To uninstall sensor software use the follow command with the sensor installer
sudo ./sensor_installer.sh uninstall
This process does not delete sensor data from log search or remove any alerts/investigations from IDR which originated from deleted sensors.