Get started with Attack Surface Management (Surface Command)
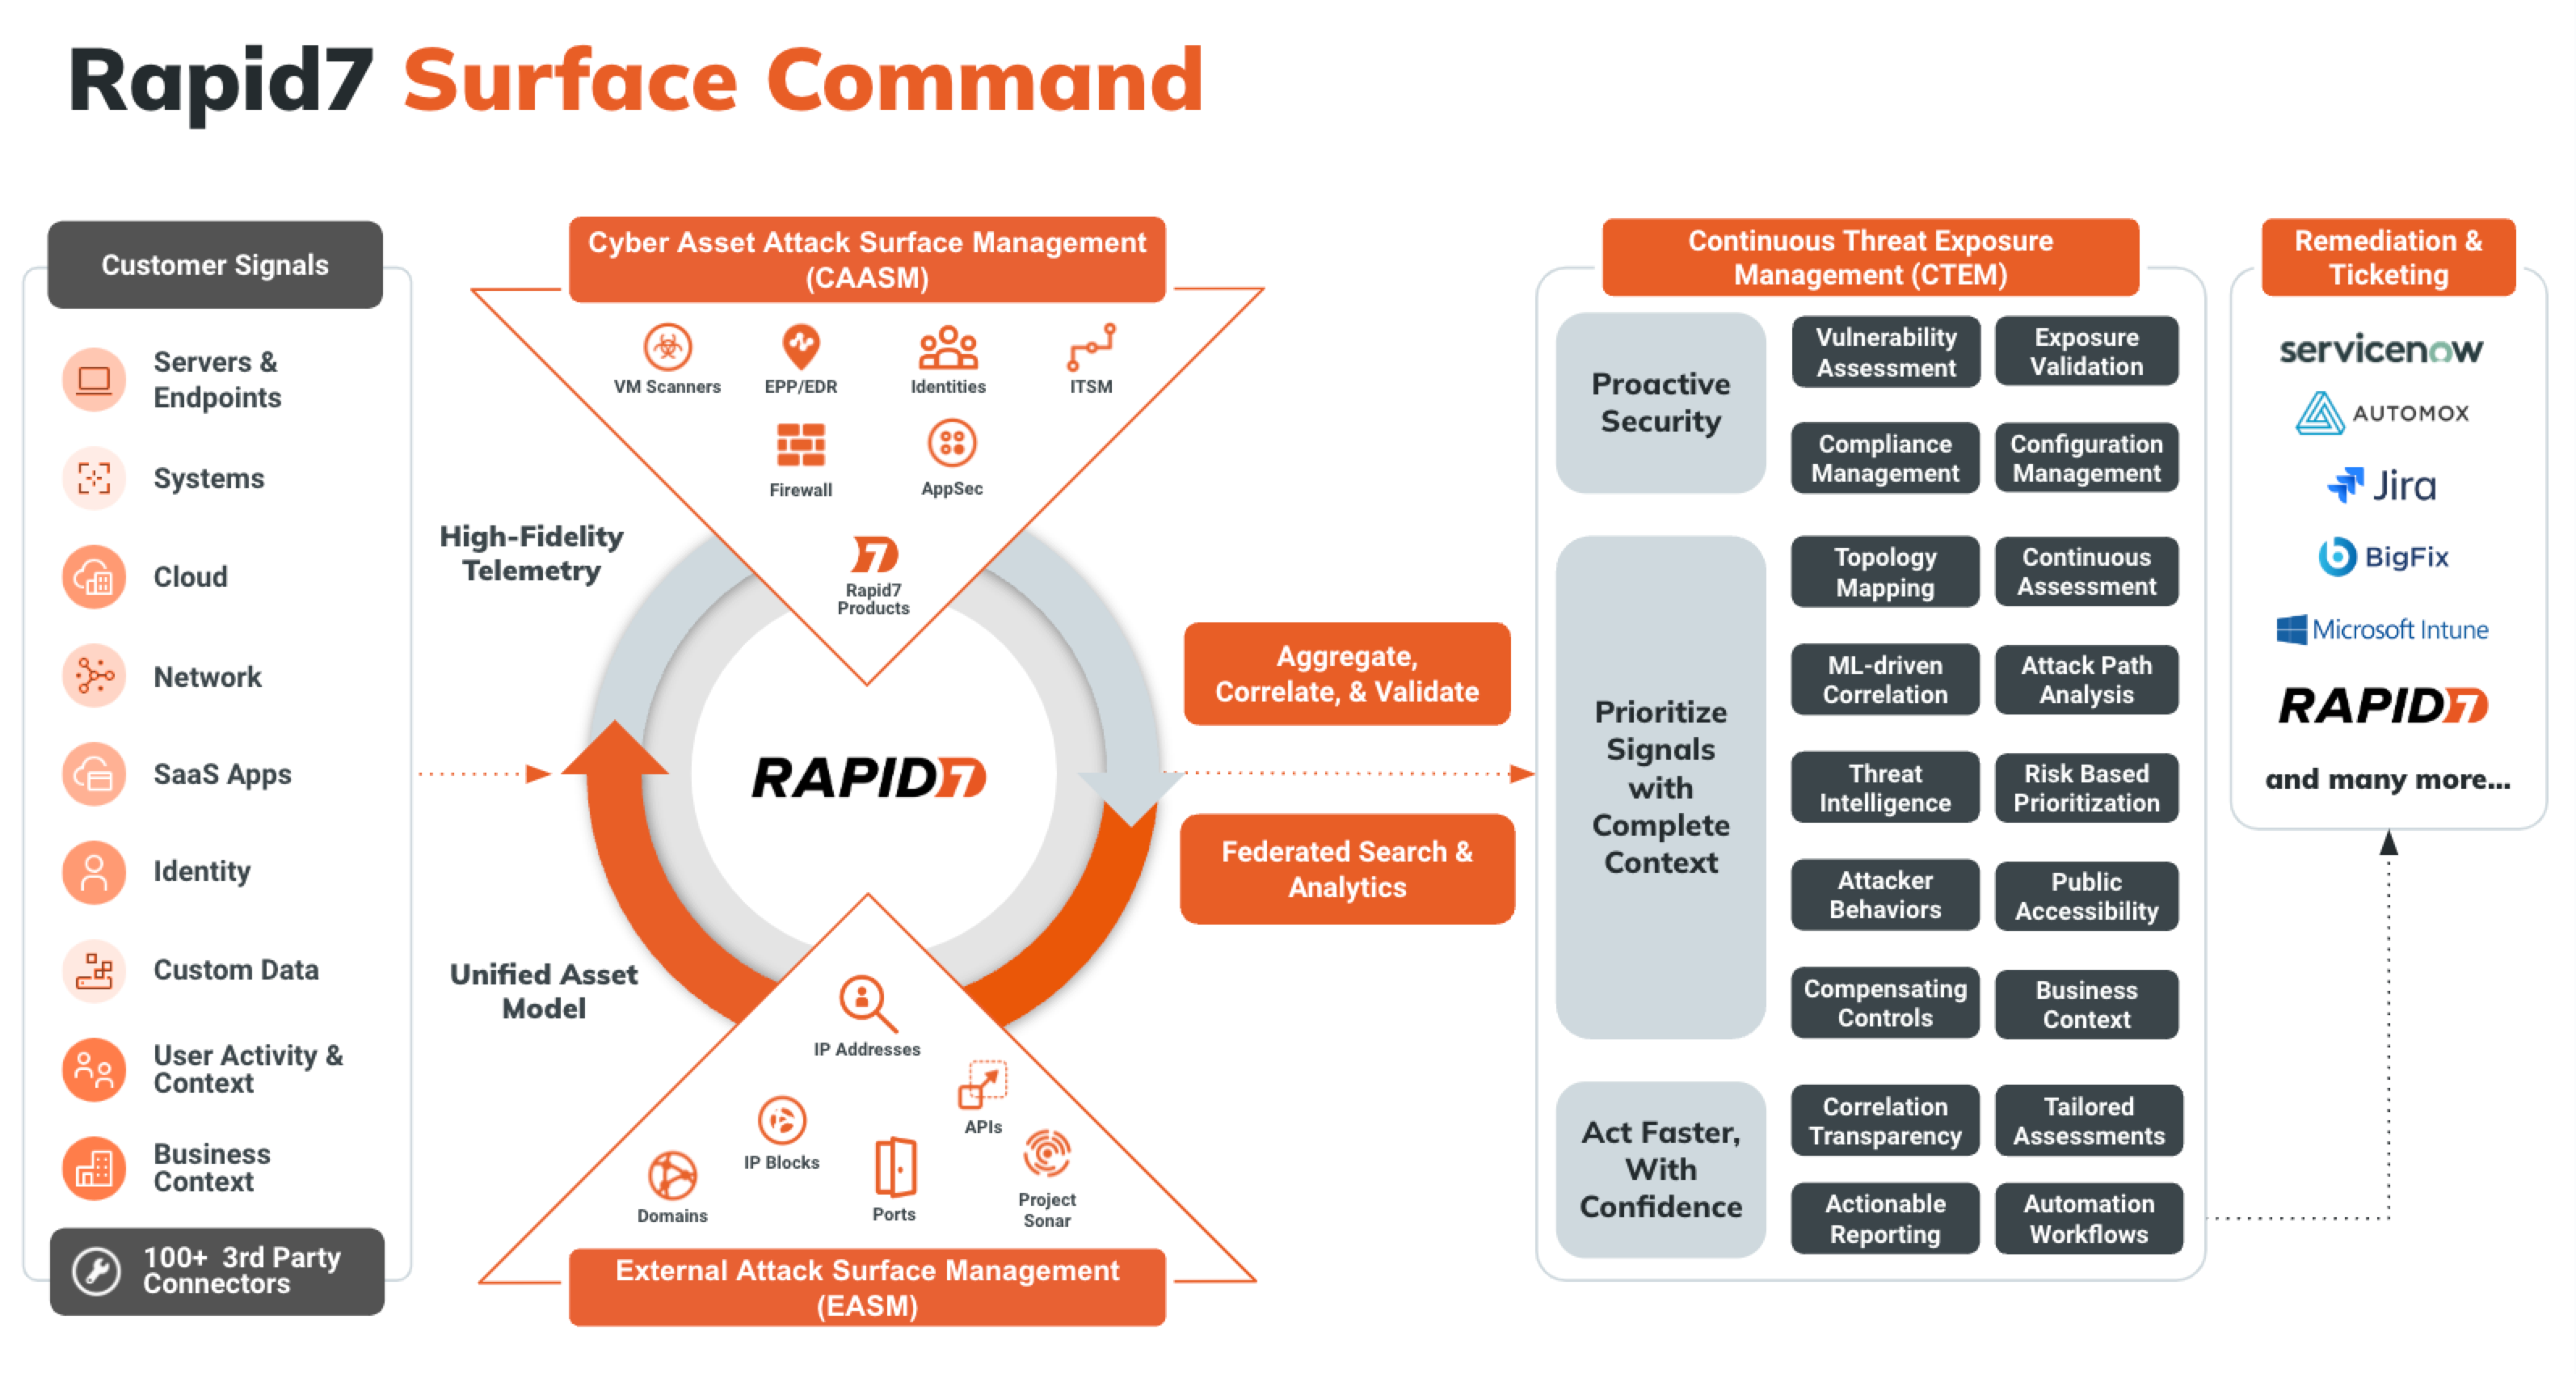
Attack Surface Management (Surface Command) unifies asset data across hybrid environments to break down silos and deliver a comprehensive, real-time view of your attack surface. It combines external asset discovery with a detailed inventory of internal assets—regardless of the security or IT tool used to inventory them. Understanding how assets are configured helps you quickly identify misconfigurations, shadow IT, and compliance gaps. This integrated visibility supports proactive risk mitigation, threat prevention, and rapid incident response.
A typical onboarding experience takes just a few days. This pace helps build your confidence, develop troubleshooting skills, and reach the core value of Attack Surface Management (Surface Command) quickly. Here’s what to expect:
- Day 1: Build familiarity and configure foundational connectors - Get to know Attack Surface Management (Surface Command)’s key concepts and start connecting your key assets.
- Day 2: Validate configuration and add more connectors - Validate your Day 1 setup and add SaaS-based connectors to expand attack surface visibility.
- Day 3: Explore your data - Start analyzing asset data to understand your environment and how to protect it.
- Day 4 and beyond: Customize and query - Build custom dashboards and use the Query Builder to gain insights into your attack surface.
Prerequisites
Before you begin using Attack Surface Management (Surface Command), ensure you have the following:
- A Command Platform account with the Attack Surface Management (Surface Command) Admin role assigned through a group or directly.
Log in to the Command Platform
The Command Platform is your centralized hub for managing Rapid7 solutions. To access it, you’ll need an account.
Already have an account?
If you previously used the Command Platform (Insight Platform) for another Rapid7 solution, you’re all set! Log in at https://insight.rapid7.com/login with your existing email.
To create an account:
- Check your corporate email inbox for an email from the Command Platform team.
- Visit [https://insight.rapid7.com/login ]
- Select Haven’t activated your account?
- Enter your corporate email address to receive an activation email.
- Didn’t get it? Contact your Customer Adoption Manager (CAM) or Customer Success Advisor (CSA).
- Follow the activation email instructions to complete setup.
Day 1: Build familiarity and configure foundational connectors
Your first day in Attack Surface Management (Surface Command) focuses on getting comfortable with the interface and terminology while starting to map your external attack surface. You’ll do this by adding discovery seeds and configuring the foundational connectors that power data correlation across the platform.
Day 1 outcomes
By the end of Day 1, you’ll have:
- Familiarity with the Attack Surface Management (Surface Command) interface and core terminology
- External asset data connected to Attack Surface Management (Surface Command)
- Key connectors installed and operational
Key Attack Surface Management (Surface Command) concepts and components
Before you begin, review the core concepts and components that define Attack Surface Management (Surface Command):
- Connector - A software component that enables Attack Surface Management (Surface Command) to collect data from an information source, such as vulnerability scanners, endpoint protection platforms, or cloud services. Each connector understands the API and data schema of its target source. Attack Surface Management (Surface Command) provides connectors for most major tools and supports custom connectors for enterprise-specific systems. Learn more about Connectors.
- Orchestrator - A software component deployed in your environment when Attack Surface Management (Surface Command) cannot access an information source directly. Orchestrators collect data from internal or private cloud sources and can also execute actions. After deployment, orchestrators are paired to Attack Surface Management (Surface Command), and one or more connectors are assigned to them.
- Profile - A configuration that contains credentials and import feeds for a specific connector.
- Import Feed - A scheduled task that runs a specific data ingestion job. A connector may have multiple associated import feeds.
- Attack Surface - Divided into internal and external components. The internal surface includes assets and identities. The external surface includes IPs, domains, certificates, and services exposed to the internet. Attack Surface Management (Surface Command) discovers external assets using domain and IP seeds. Learn more about your Attack Surface Management (Surface Command) attack surface.
- Asset - Any network-connected device, such as a server, workstation, mobile device, or printer. Assets are created automatically when data is ingested from connectors.
- Identity - A user-based entity like a username, service account, or shared mailbox. Identities can be human or non-human.
- Seed - Registered domains and public IP networks that help describe your external footprint on the Internet, which drive a discovery process that uncovers the operational subdomains, network services, and TLS certificates used by your organization. Seeds are manually entered or managed using a connector-specific dynamic seed query.
- Type - * A schema that defines how data is structured for a specific kind of asset or identity. Each connector introduces its own types, which Attack Surface Management (Surface Command) maps into standardized unified types (for example, Server, Identity, or Vulnerability). These unified types allow for cross-source correlation and query filtering. Explore unified properties.
- Query - A request written in Cypher or built using the graphical interface to retrieve data ingested by connectors. Queries cannot modify data but can be customized to extract specific insights. Prebuilt queries are available, and you can also create your own. Learn more about Queries.
- Reference list - External data imported using Excel or CSV files that augments connector data. Use reference lists to enrich queries (for example, to correlate network zones with business units).
- Dashboard - A customizable interface that displays key metrics and insights using widgets. Dashboards help you monitor your security posture visually. Learn more about Dashboards.
- Widget - A visual component that displays filtered results from a query using charts or graphs. Widgets can be customized to show counts, trends, or metrics. The default widgets on the Attack Surface Management (Surface Command) home page provide asset counts by unified type and are not editable.
- Workflow - A repeatable software process that executes steps based on query results. Workflows can be triggered automatically or manually to drive consistent response actions. Learn more about Workflows.
- Function - A reusable unit of code that interacts with remote systems to retrieve data or take action. Functions serve as the building blocks of workflows and are typically included with connector packages.
Unified model explorer
To learn more about using the unified model explorer, see Explore unified properties.
Connect your External Assets
To discover your external attack surface, start by adding discovery seeds:
- Log in to Attack Surface Management (Surface Command).
- Go to Discovery Seeds.
- Click Add Seeds.
- Enter seeds (separated by spaces, commas, or line breaks) into the text field.
- Click Add Seeds. Rapid7’s External Asset Engine begins scanning your seeds immediately and results populate the External Attack Surface pages.
Install and schedule recommended connectors
Install the following connector to begin enriching your attack surface data:
- MITRE CWE
Installation steps for each connector follow a consistent process. Use the + Connector button to browse the Rapid7 Extension Library, install the connector, create a profile, and schedule it (where applicable).
Some connectors are installed, turned on, and scheduled by default
When you first visit the Connectors page, you’ll notice several pre-installed connectors that run by default. These include:
- CISA KEV Catalog
- First EPSS
- MITRE ATT&CK
- NIST NVD
- Rapid7 Command Platform
- Rapid7 Vulnerability Enrichment
- Surface Command Built-ins
- Surface Command Dashboards
- Surface Command Machine Learning
These provide essential platform functionality and don’t require management.
Day 2: Validate configuration and add more connectors
Your second day in Attack Surface Management (Surface Command) begins with using default dashboards to verify your asset data availability and that connectors are functioning correctly. You’ll then spend time installing additional connectors, as needed.
Day 2 outcomes
By the end of day 2, you’ll have:
- Verified external and internal asset data availability
- Validated installed connectors
- Installed at least one connector per major category
- Learned how to troubleshoot connectors and import feeds
Validate with default dashboards
Attack Surface Management (Surface Command) includes default dashboards to help confirm that asset data and connector integrations are working:
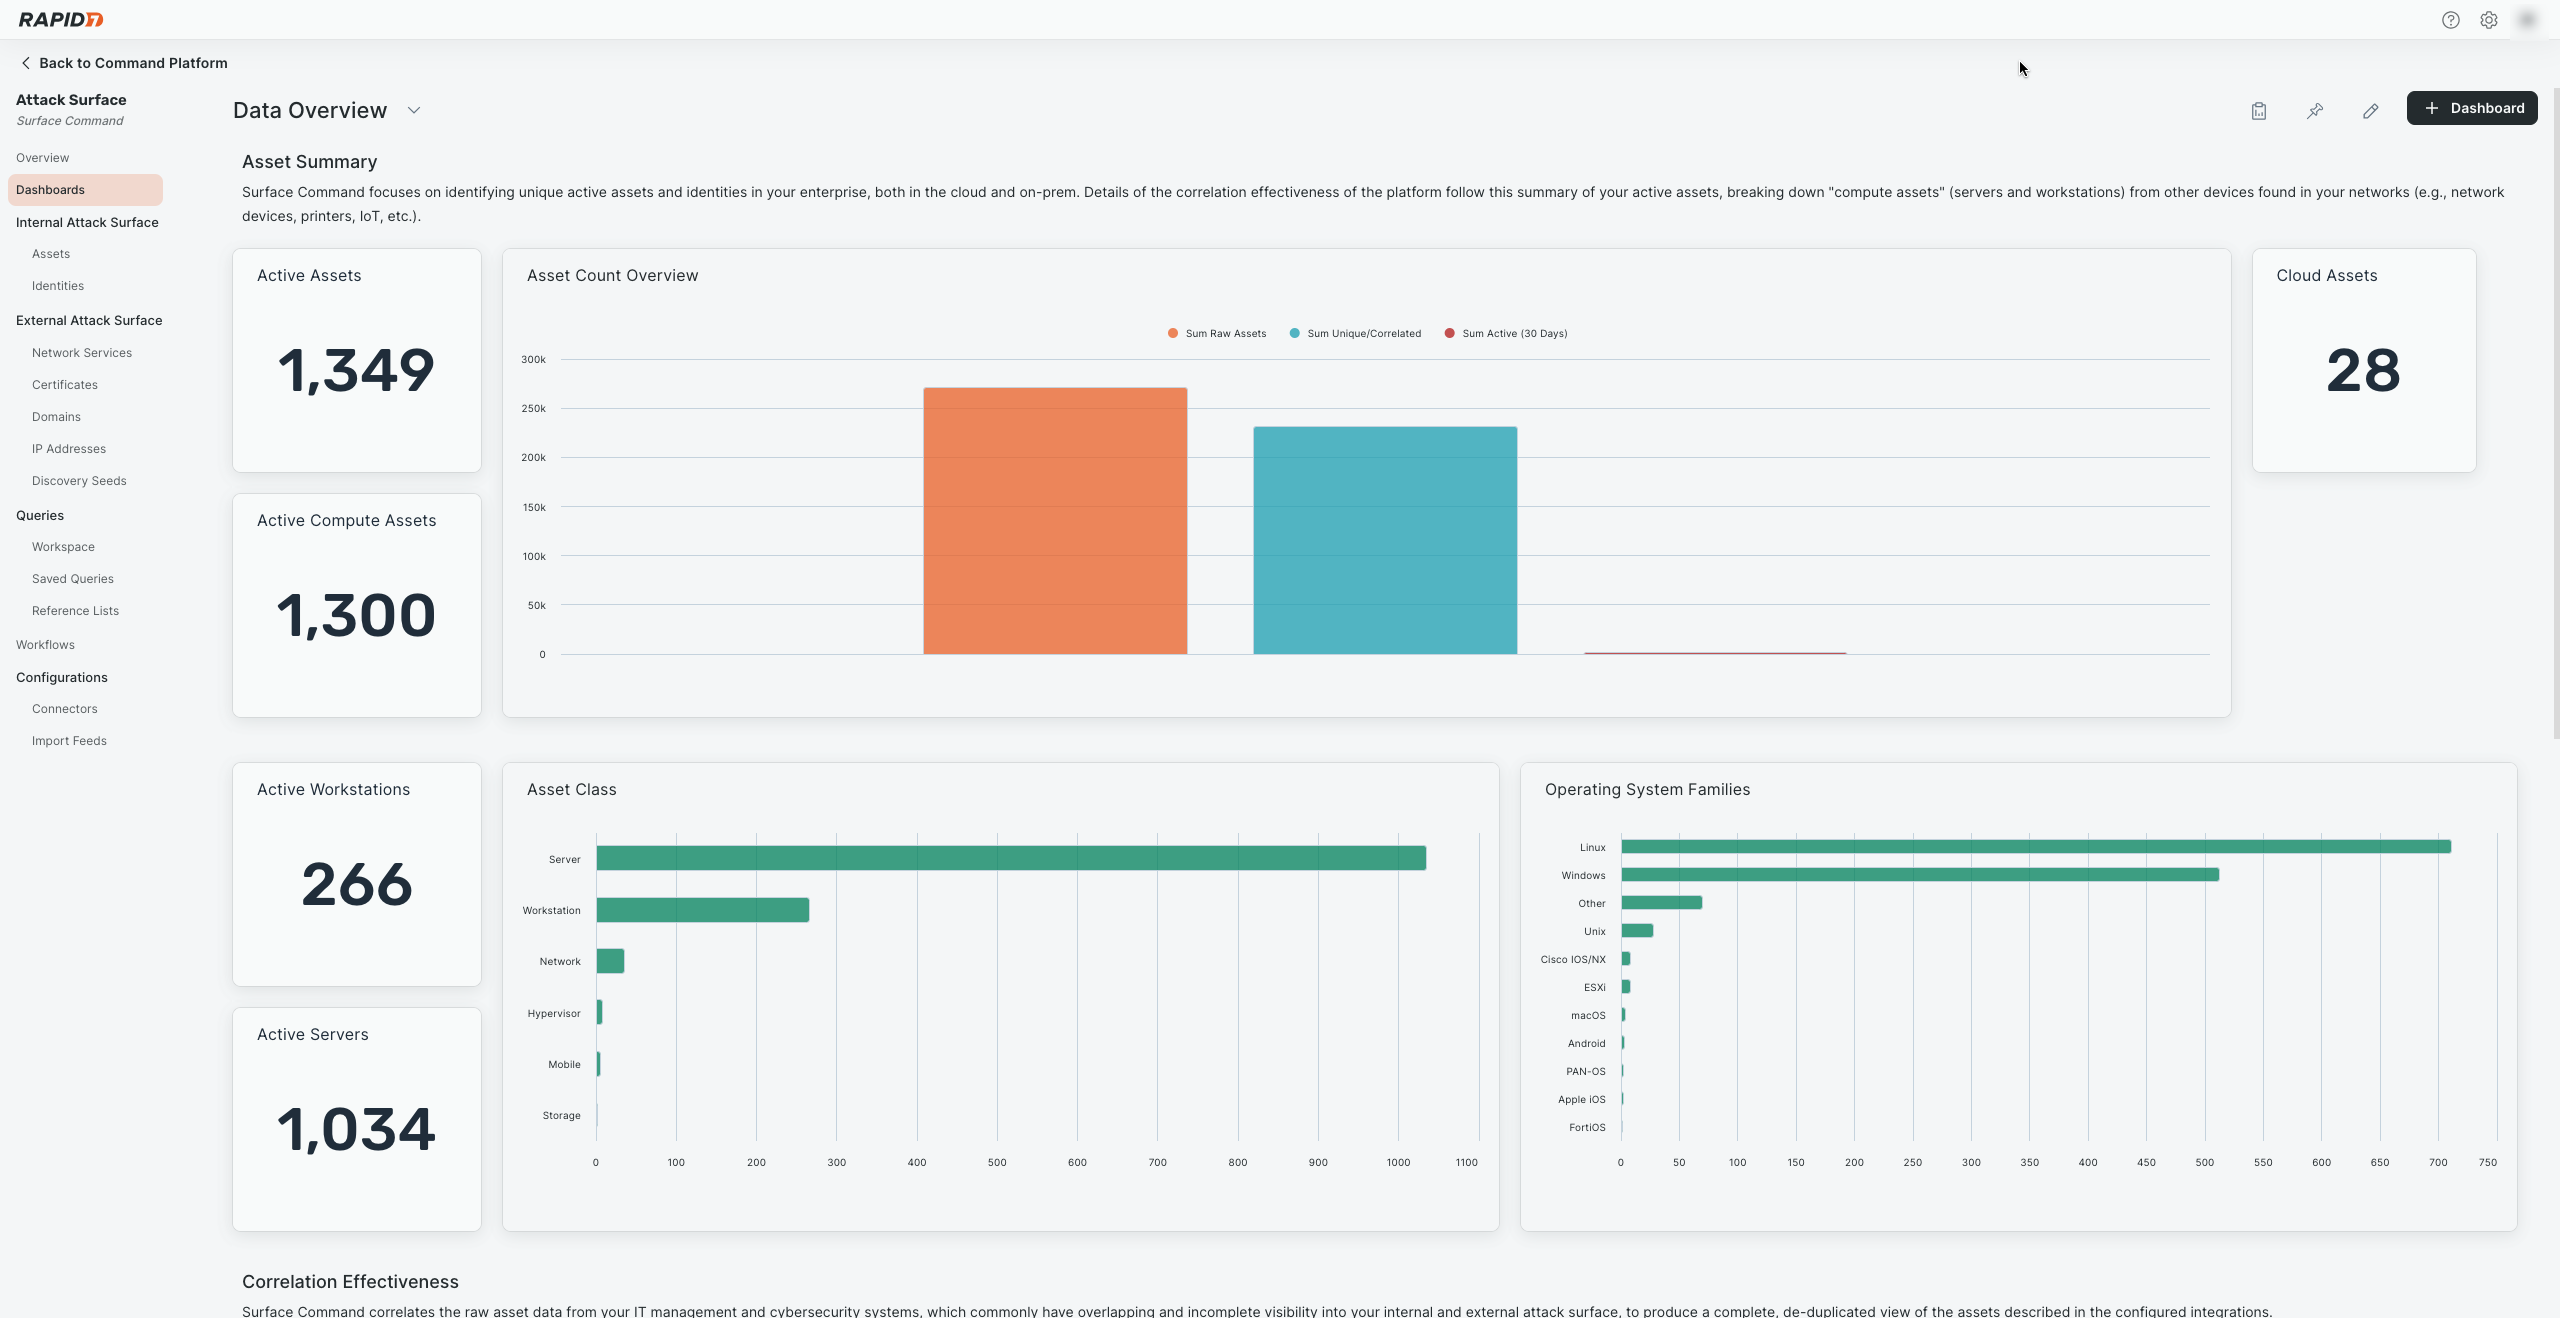
- Data Overview - Displays asset counts and correlation summaries.
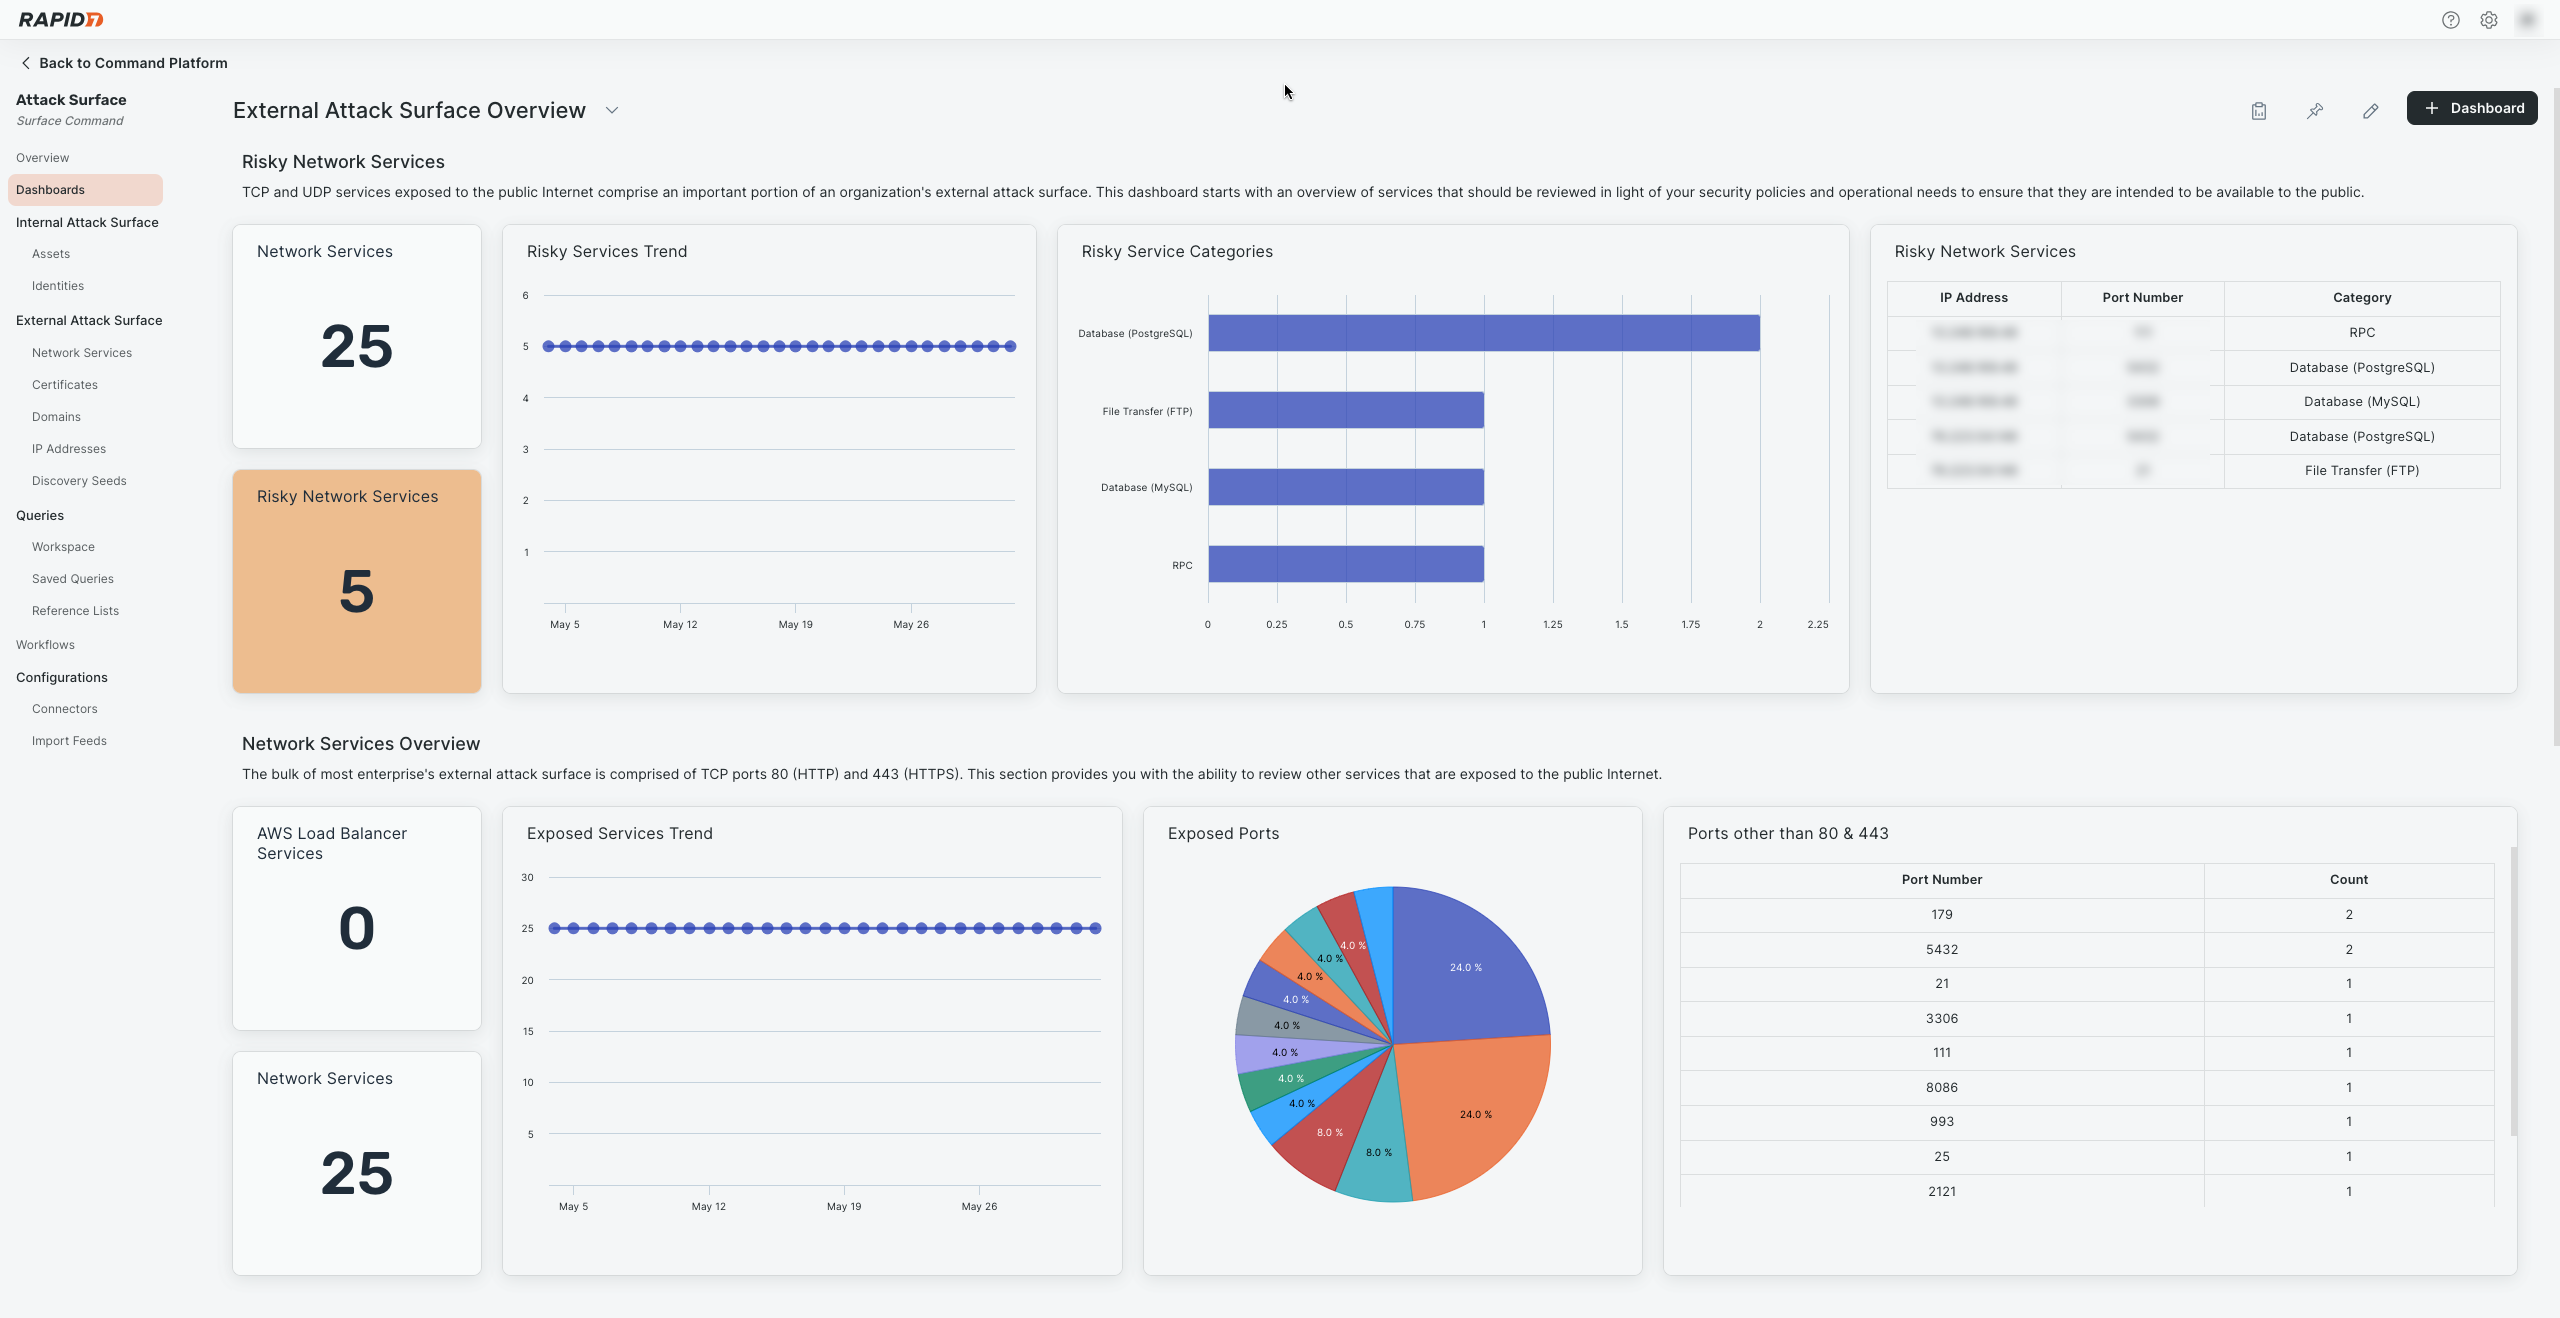
- External Attack Surface Overview - Tracks trends and counts for network services, risky exposures, and TLS certificates.
- Controls Overview - Highlights gaps in EDR coverage, vulnerability scanning, and MFA configurations.
Use these dashboards to confirm that external assets data is available and that the Command Platform connector is actively collecting Rapid7 asset data.
To confirm Command Platform connector data collection:
- Open Attack Surface Management (Surface Command).
- Go to Dashboards.
- Select Data Overview from the dashboard name drop-down menu.
- Confirm that widgets are populated with data.
This is an example of a working dashboard:
To verify external asset data availability:
- Go to Dashboards.
- Select External Attack Surface Overview from the dashboard name drop-down menu.
- Confirm that widgets are populated with data.
This is an example of a working dashboard:
Install SaaS Connectors
To map your attack surface more effectively, we recommend installing multiple SaaS-based connectors from the categories in the following table. You should consider the various questions and use cases you want to address and identify the sources which contain the relevant information needed to address them.:
To strengthen your attack surface mapping, install SaaS-based connectors from the recommended categories included in this section. Choose connectors based on your organization’s use cases and data sources.
Explore the Extension Library
Explore the Extension Library to find and connect to key services and software (no login required).
| Category | Example Connectors |
|---|---|
| Endpoint Detection & Response / Endpoint Management |
|
| Identity & Access Management |
|
| Network & Firewall |
|
| Vulnerability Management |
|
We recommend starting with SaaS connectors due to their ease of configuration and management. These connectors typically require only credentials and minimal setup.
Rapid7 recommends starting with SaaS-based connectors because they’re easier to configure, manage, and test as they simply rely on credentials.
To install a connector:
- Go to Connectors.
- Click + Connector to open the Extension Library.
- Search for a connector.
- Click the connector name. The Overview page for the connector opens.
- Click Documentation to view setup instructions.
Troubleshooting connectors
The most common issue during connector setup is incorrect credentials. You can validate connector health using test connection functionality or import feed logs.
Test functionality limitations
The ability to test a connection depends on the information source supporting this functionality with their API.
To test a connection:
- Go to Connectors.
- Click a connector.
- Click Settings.
- Next to a profile, click Test connection. Attack Surface Management (Surface Command) reports any errors found using the credentials.
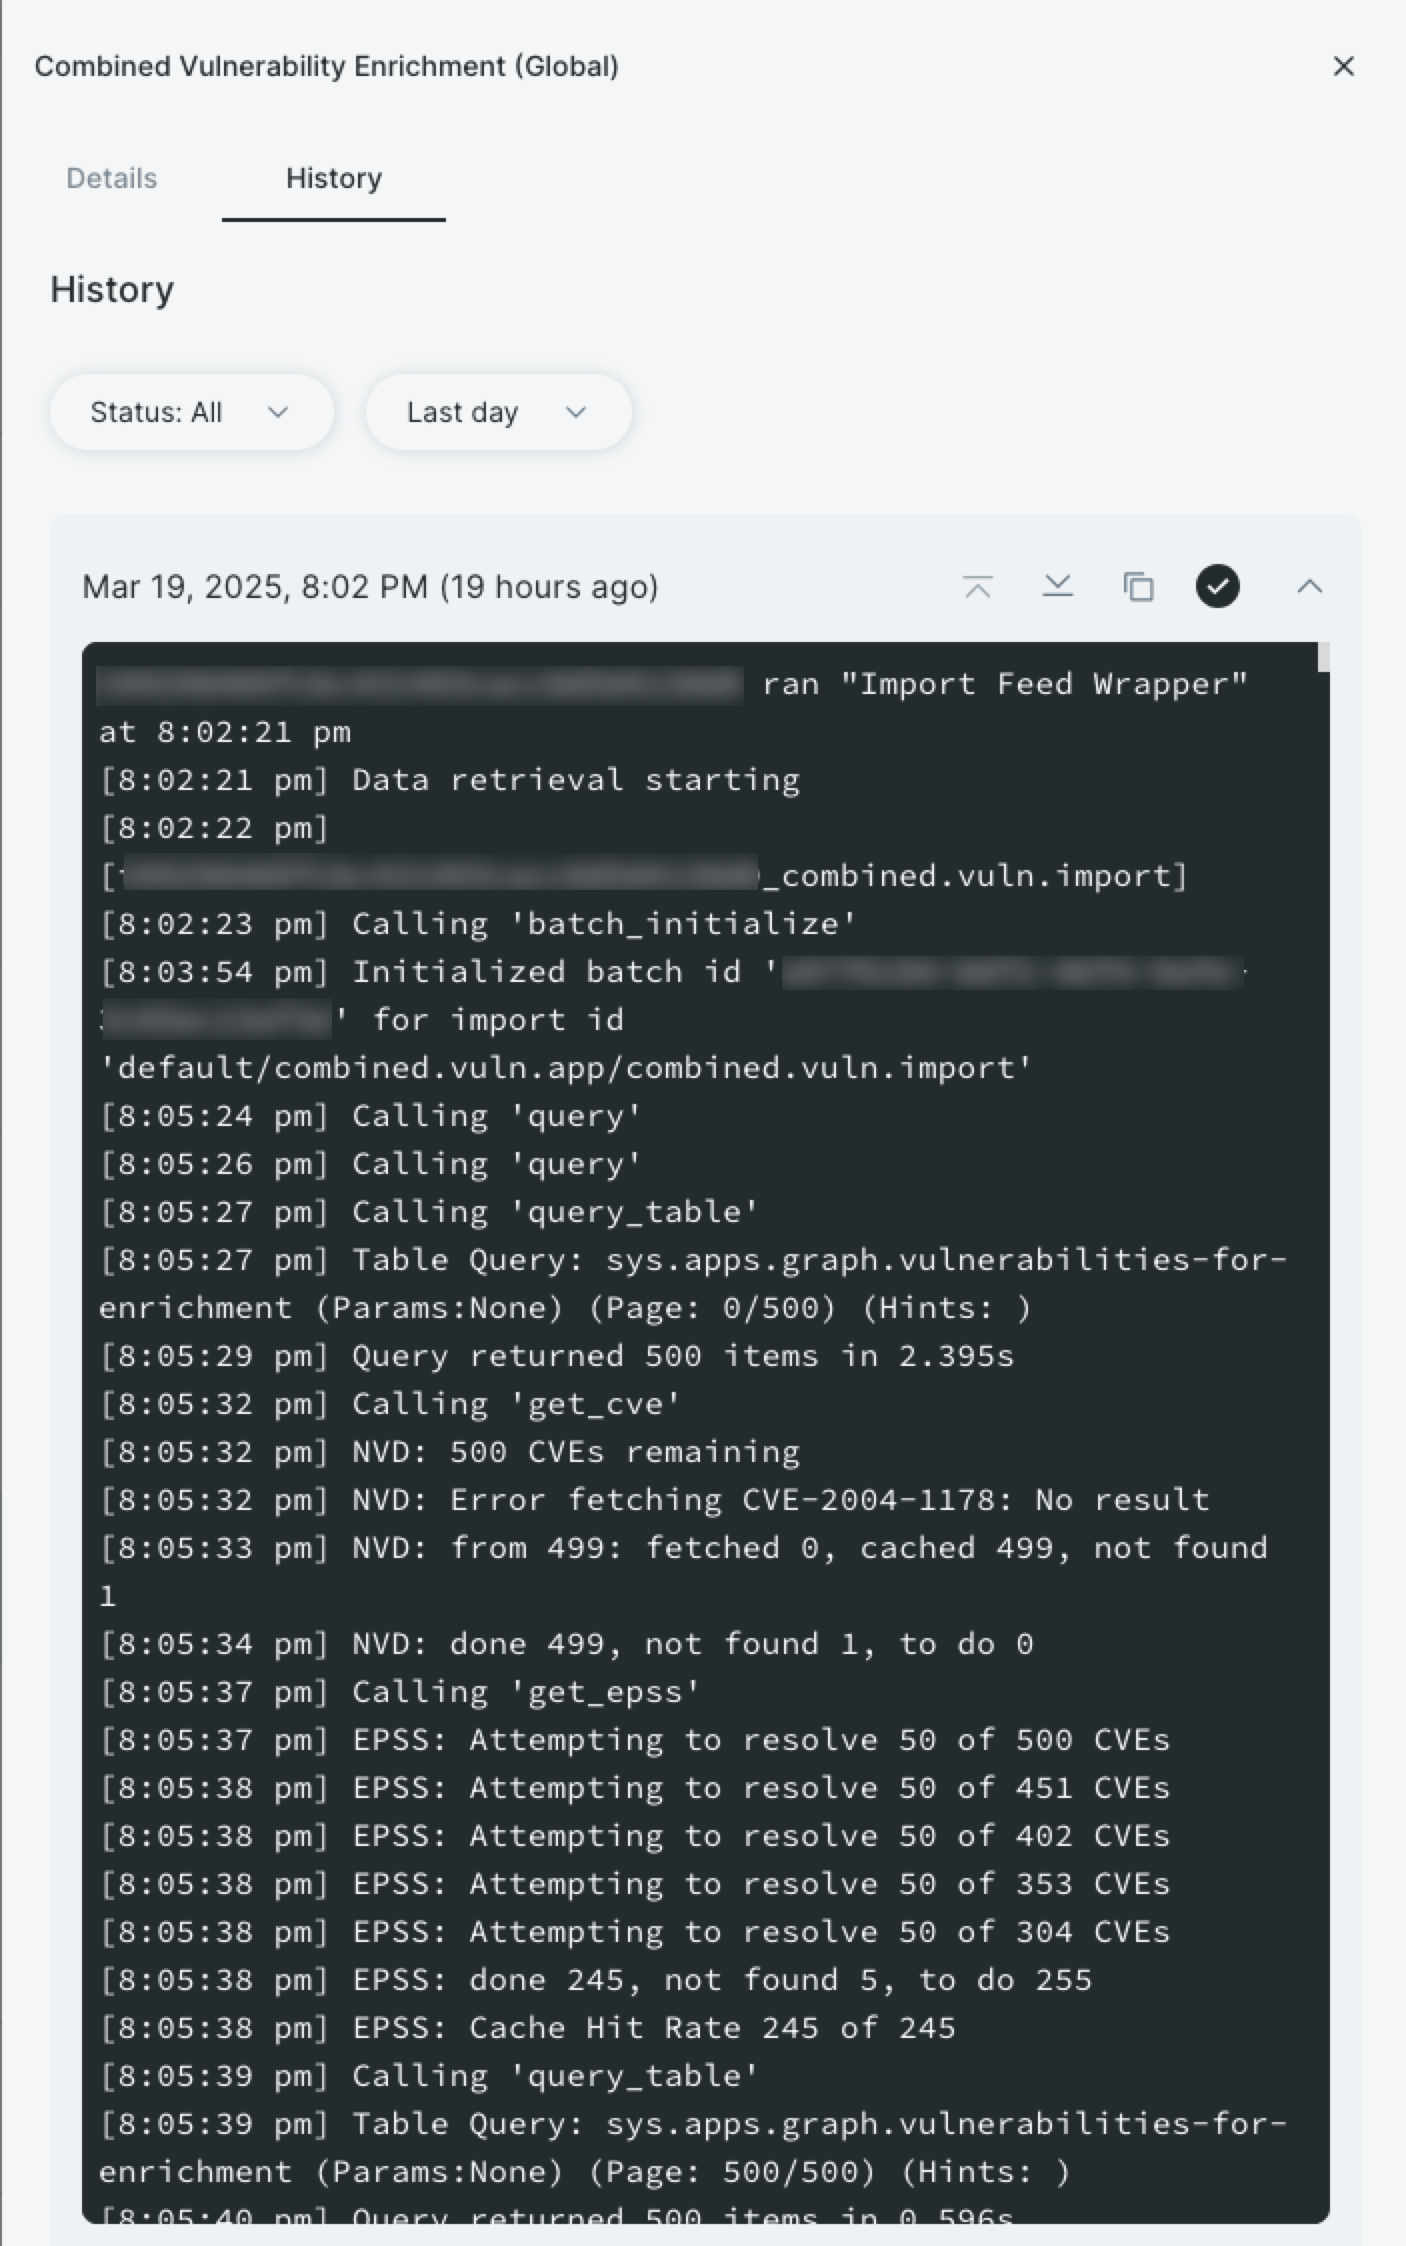
To view import feed logs:
- Go to Import Feeds.
- Search for a connector.
- Click an import feed.
- Click History.
- Expand a completed job date. The log loads.
Day 3: Explore your data
Now that data is flowing regularly, Day 3 focuses on exploring your attack surface. You’ll learn how to navigate and filter your assets and identities and save custom views for use on Day 4.
Day 3 outcomes
By the end of Day 3, you’ll have:
- Explored your attack surface
- Learned about unified properties and correlation
- Saved custom filters for common use cases
Explore your attack surface
As introduced on Day 1, your attack surface consists of internal and external components. In Attack Surface Management (Surface Command), the internal surface includes assets and identities. The external surface includes IP addresses, domains, network services, and certificates. Discovery of the external surface is driven by domain and IP seeds.
All views for these components function similarly (except for the Discovery Seeds page), so the instructions in this section apply generally. For more context on asset types and their properties, revisit Day 1.
When you open a view in Attack Surface Management (Surface Command), you’ll see a table displaying common properties for each asset type. Use these key features to explore your data:
- Click Manage table columns (the last column header in the table) to add or remove properties.
- Click Edit in Workspace to move the current view to the Workspace (see Day 4 for details).
- Click Menu > View graph to view a relationship graph for the selected asset (sometimes referred to as a blast radius).
- Click Filter views to see saved filters.
Click any asset to open the Properties panel, which includes a General tab and tabs for each connector with data on that asset. Hover over the info icon next to a property to see its source details:
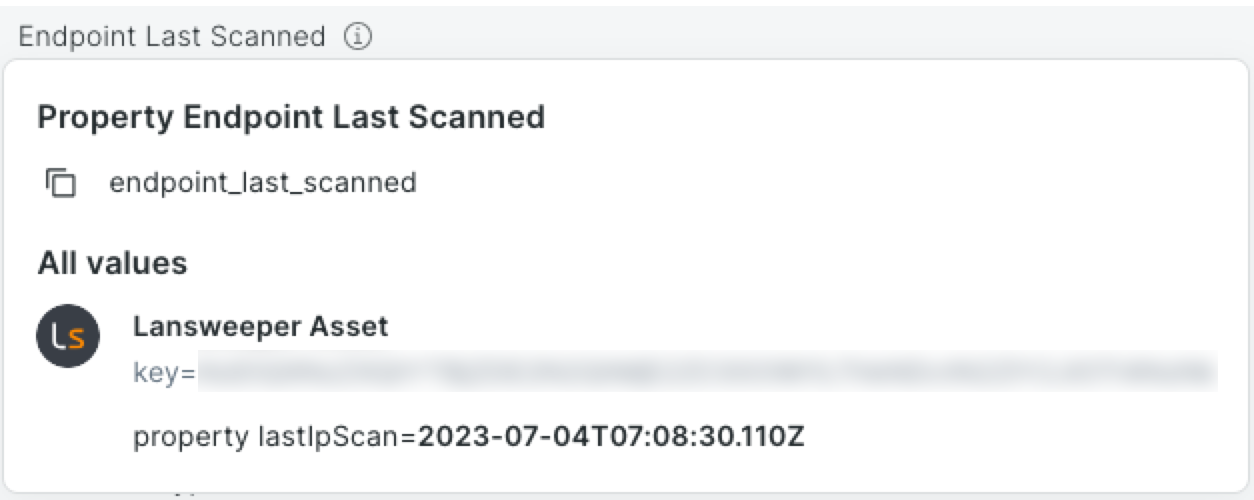
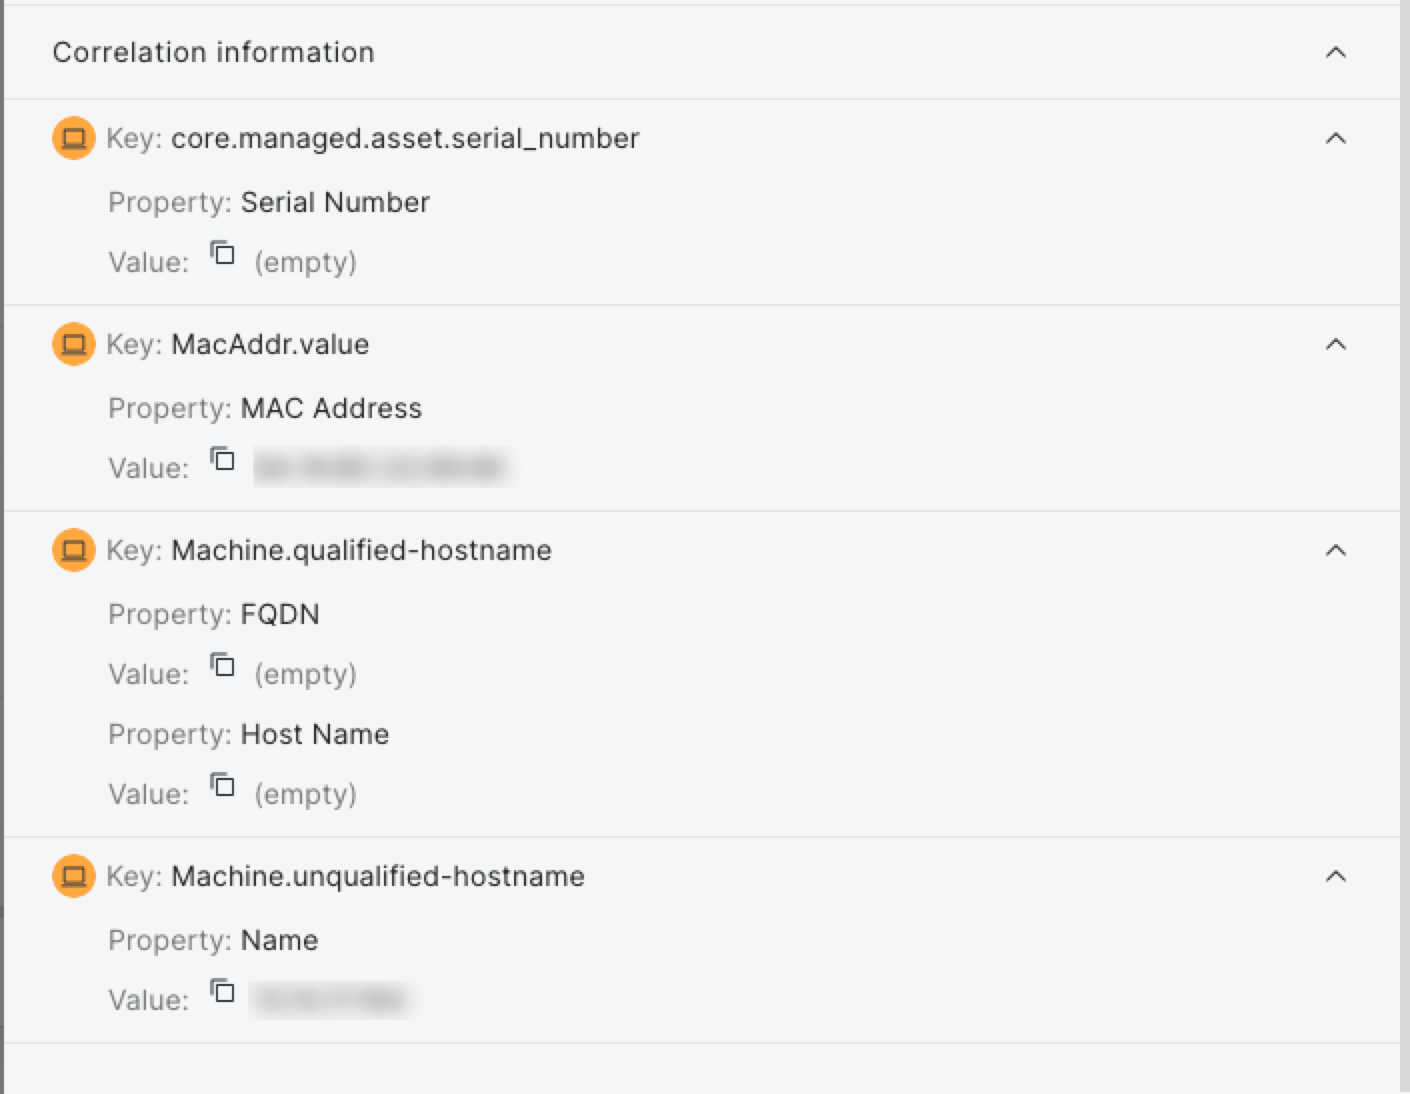
Expand the Correlation Information section at the bottom of each tab to view key properties used to correlate records into a unified view.
Something wrong with the correlation?
Rapid7 can help you fine-tune these correlations. Contact support for details.
Filter your attack surface
You can filter views by any property by using the + Filter button or the Filter icon in column headers. Note that the Sources property is special because you can filter by coverage gap (assets that do not have the selected sources) or by source (assets that do have the selected sources).
When filtering by a related asset type (for example, mitigations or vulnerabilities), you can further refine your view by selecting specific criteria, such as vulnerabilities with a critical severity. After filtering, you can save your view for future use. Use the Filter Views menu to access saved and default filters (marked with a lock icon).
You’ll create the following filters for Day 4:
- Assets without vulnerability scanning
- Assets that have vulnerabilities with a CVSS score of 9 or higher
- Active Windows servers without endpoint protection
To create the “Assets Without Vulnerability Scanning” filter:
- Open Attack Surface Management (Surface Command).
- Go to Assets.
- Click Manage table columns.
- Under Additional properties, click Mitigations.
- Click Apply.
- Click + Filter, search for Mitigations, and select it.
- Set the filter to Id is empty. The table loads to display assets without vulnerability scanning.
- Click Save, provide a filter name and description, and confirm.
To create the “Assets With Vulnerabilities ≥ 9” filter:
- Go to Assets.
- Click Manage table columns.
- Under Additional properties, click Vulnerabilities.
- Click Apply.
- Click + Filter, search for Vulnerabilities, and select it.
- Set the filter to CVSS Score greater than or equal to 9. The table loads to display assets a CVSS score of 9 or higher.
- Click Save, provide a filter name and description, and confirm.
To create the “Active Windows Servers Without Endpoint Protection” filter:
- Go to Assets.
- Click + Filter, search for OS Family, and select it.
- Click Only next to Windows.
- Click the Filter icon in the Sources column.
- Search for Rapid7 Agent (Insight Agent) (you could also select any other relevant endpoint protection). It is selected automatically.
- Click the Filter icon in the Endpoint Last Seen column.
- Select Timeframe and Last 90 days. The table loads to display assets without vulnerability scanning.
- Click Save, provide a filter name and description, and confirm.
Day 4 and beyond: Customize and query
Now that you’re comfortable with Attack Surface Management (Surface Command), have high attack surface visibility, and have explored your assets in depth, you’re ready to build widgets and dashboards. If filters aren’t flexible enough for your needs, you can get started with the Query Builder inside the Workspace.
Day 4 outcomes
By the end of Day 4, you’ll have:
- Learned how to create widgets and dashboards
- Created two widgets and added them to a dashboard
- Learned how to use the Query Builder
Build widgets
Widgets are created from saved queries and are the main content for dashboards. You’ll need to convert your saved asset filters into Workspace queries before building widgets.
To build a number widget for the “Active Windows Servers Without Endpoint Protection” saved filter:
- Open Attack Surface Management (Surface Command).
- Go to Assets.
- Click Filter views, then select the “Active Windows Servers Without Endpoint Protection” saved filter.
- Click Edit in workspace to convert the filter to a Workspace query.
- Click Execute query (play icon).
- Click Save query, provide a name and description.
- Toggle Create widgets to create a widget from the query now.
- Click Save. The query is saved and the Saved Queries page for it loads.
- Click the Widgets tab.
- Click + Create a widget.
- Name and describe the widget.
- Click Number.
- Under the Data tab, select Count as the measure.
- Under the Format tab, choose Number.
- Optionally, add conditional formatting or change the widget color.
- Click Save.
To build a pie chart widget for the “Assets Without Vulnerability Scanning” saved filter:
- Go to Assets.
- Click Filter views, then select the “Assets Without Vulnerability Scanning” saved filter.
- Click Edit in workspace to convert the filter to a Workspace query.
- Click Execute query (play icon).
- Click Save query, provide a name and description.
- Toggle Create widgets to create a widget from the query now.
- Click Save. The query is saved and the Saved Queries page for it loads.
- Click the Widgets tab.
- Click + Create a widget.
- Name and describe the widget.
- Click Pie.
- Under the Data tab:
- Select Count as the measure.
- Toggle on Dimensions and select Sources.
- Under the Format tab:
- Toggle on Legend.
- Optionally, change the widget starting color.
- Click Save.
Build a dashboard
Dashboards organize widgets into sections. All widgets in Attack Surface Management (Surface Command) are shared, so you can use any of them in your dashboards.
To create a dashboard:
- Go to Dashboards.
- Click + Dashboard, then name and describe it.
- Click + Widgets.
- Search for the “Assets Without Vulnerability Scanning” and “Active Windows Servers Without Endpoint Protection” widgets and click +.
- Close the Add widgets panel.
- Use the arrow icons on the widgets to arrange them.
- Click Save.
Use the Query Builder
The Query Builder is a powerful tool in the Workspace for identifying relationships between asset types, which makes it easier to identify risks associated with shadow IT, vulnerabilities, and misconfigurations. For example, querying to find unencrypted Windows compute devices (Assets) that have a known Business Owner (Identity).
Query building options
You can build queries with the visual builder or write Cypher queries directly. While Cypher is out of scope for this guide, you can learn more in Using Cypher .
By default, you can only select Unified Asset Model types, but you can reveal connector source types by clicking Show source types. Click a type to get started.
- Types are located on the left side of the Query Builder.
- Click Add relationship to add a type relationship to the query. For example, an asset might have several relationships to a user, such as Business Owners and Technical Owners.
- Click Filter result to narrow asset types. For example, matching active Windows-based assets to admin users.
- Click Edit return properties to customize output. You can provide a human-readable alias for any property name.
- Returned properties are located on the right side of the Query Builder.
- Toggle Distinct to de-duplicate results. For example, if you’re querying for assets with high CVSS score vulnerabilities and a particular asset has three vulnerabilities that meet that criteria, the results will contain three rows, regardless of the properties selected to return. If you toggle Distinct, the results will only contain unique, or distinct, Assets so it will only return a single row for that Asset.
- Click Edit (pencil icon) to alias fields or modify properties.
- Click Set order to change the order of the results.
Use Query Builder with Unified Asset Model open
The Unified Asset Model shows all type relationships. Keep it open in another tab while building queries for reference.
To build a query to find unencrypted Windows compute devices that have a known Business Owner:
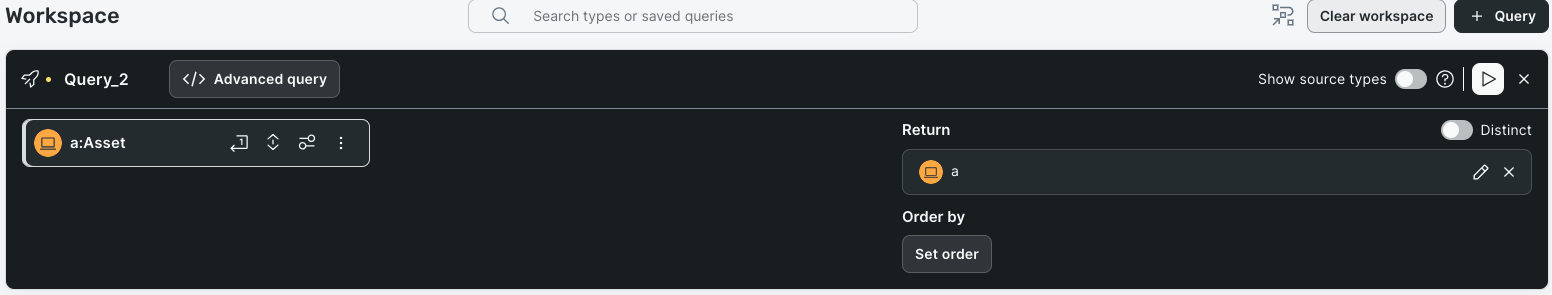
- Go to Workspace.
- Click + Query.
- Click Asset.
- Click Filter result and select Active? is true.
- Click + to add another property and select OS Family is equal to Windows.
- Click Add relationship, select Identity, then select the Asset -> Identity relationship path.
- Change any to Business Owner(s).
- Click Edit return properties, select and optionally alias owners.
- Click Apply, then toggle Distinct.
- Click Execute query (play icon). The query loads.
- Click Save query, then name and describe the query.
- Click Save. The query is saved and the Saved Queries page for it loads.
Connect with Rapid7
Support
If you run into any problems with Attack Surface Management (Surface Command), search the documentation for solutions or contact Rapid7 Support through the customer portal .
Rapid7 Academy
The Rapid7 Academy holds training, webcasts, workshops, and more, all led by our Rapid7 experts.
- On-demand training helps you get started with Rapid7 products, answer frequently-asked questions, and recommend best practices.
- Rapid7 Webcasts are hosted by Rapid7’s teams and provide a forum where customers can learn about best practices as well as what’s new in their Rapid7 products.
- Virtual Instructor-Led Training Courses are live training sessions broken down by product and available for enrollment.
- Certification Exams are product-specific exams to help you demonstrate your knowledge of using Rapid7’s solutions as a cybersecurity professional.
- Product Workshops are Rapid7’s free training on all things, all products, and are on average about an hour long.
Communications
To make sure you receive the Rapid7 communications that best suit your needs, set your communication preferences .
- Whether it’s an emergent cybersecurity threat, a product update, or a notice of service degradation for maintenance, we’ll alert you with an in-product message to ensure you’re aware of all that affects your environment.\
- Rapid7’s research provides information on a variety of topics, such as, cloud misconfigurations, vulnerability management, detection and response, application security, and more.
- Rapid7’s blog offers conversational guidance and information from our security experts.
Communities
Rapid7 supports a range of open-source projects. Consider joining one of our Open-Source communities!
- AttackerKB captures, highlights, and expands on security researcher knowledge to shed light on the specific conditions and characteristics that make a vulnerability exploitable and useful to attackers.
- Velociraptor provides you with the ability to more effectively respond to a wide range of digital forensic and cyber incident response investigations and data breaches.
- Metasploit empowers and arms defenders to stay one step ahead of the game by verifying vulnerabilities, managing security assessments, and improving security awareness.
- Recog is a framework for identifying products, services, operating systems, and hardware by matching fingerprints against data returned from various network probes.
- Our customer advocacy program, Rapid7 Voice, provides you with a network of customers, offers the chance to deepen your security expertise, and provides the opportunity to share input on future product developments.