Barracuda Web Security Gateway
Web filters and web proxies filters content and URLs, protecting any web browsing from malware, inappropriate content, and more.
Learn more about Barracuda Web Security Gateway here: https://campus.barracuda.com/product/websecuritygateway/doc/6160435/syslog-and-the-barracuda-web-security-gateway/?sl=AWuK6zMxgApyUO0LKStN&so=1
Before You Begin
You must enable syslog logging in the proper format in your Barracuda Web Filter appliance before configuring this event source in SIEM (InsightIDR).
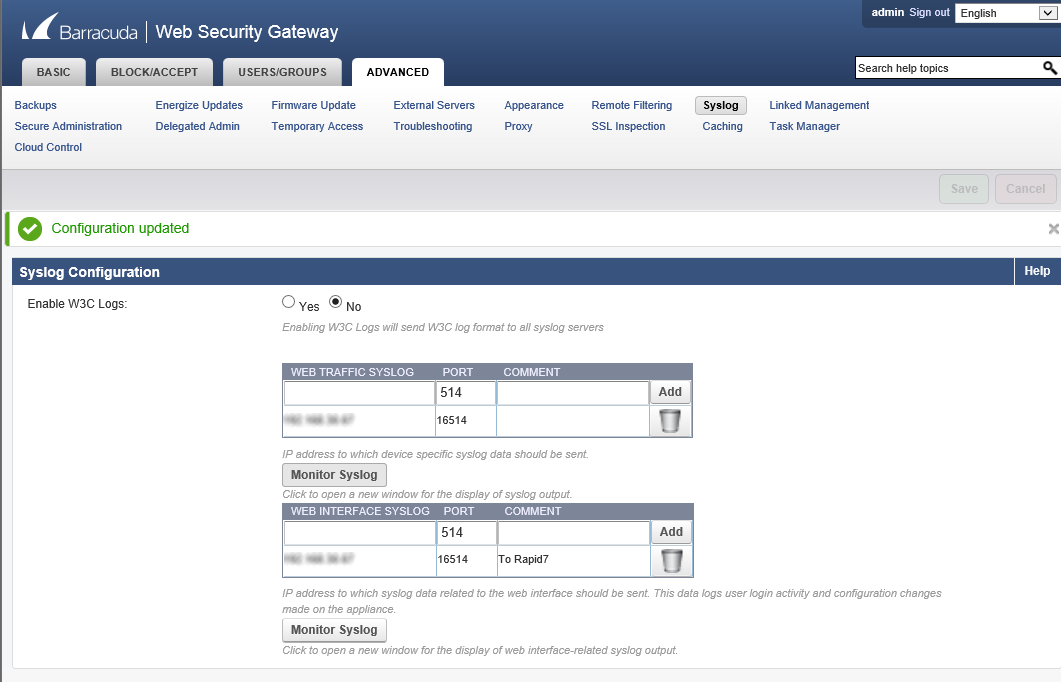
To enable syslog logging:
- Go to your Barracuda appliance.
- Select the Advanced tab.
- Select Syslog from the available options. A syslog configuration page appears.
- For “Enable W3C Logs,” select the No radio button.
- In the “Web Traffic Syslog” table, enter the port of your Barracuda appliance.
- Click the Add button on the right.
- Then enter the IP address and port of your SIEM (InsightIDR) collector.
- In the “Web Interface Syslog” table, repeat steps 6 and 7.
- Enter a comment in the “Comment” cell to identify these logs.
- Click the Save button.
Configure SIEM (InsightIDR) to collect data from the event source
After you complete the prerequisite steps and configure the event source to send data, you must add the event source in SIEM (InsightIDR).
To configure the new event source in SIEM (InsightIDR):
- From the left menu, go to Data Collection and click Setup Event Source > Add Event Source.
- Do one of the following:
- Search for Barracuda Web Filter in the event sources search bar.
- In the Product Type filter, select Web Proxy.
- Select the Barracuda Web Filter event source tile.
- Choose your collector and event source. You can also name your event source if you want.
- Choose the timezone that matches the location of your event source logs.
- Optionally choose to send unparsed logs.
- Select Listen on Network Port and specify the port you entered in the appliance, and a protocol.
- Optionally choose to Encrypt the event source if choosing TCP by downloading the Rapid7 Certificate.
- Click Save.
After this event source is running, you will see data populating the Ingress map and the Ingress card on the Users & Accounts page.