Log Data Collection and Storage
Data retention policy and log storage policy changes as of Feb 2, 2022
You no longer need to import logs from cold storage. All 13 months of retained data stored by default is now available in Log Search.
After you configure your core event sources, the Collector automatically begins to normalize and analyze data as it is ingested. Your data populates various pages, dashboards, widgets, and key performance indicators (KPIs) after events are processed. SIEM (InsightIDR) does not ingest or analyze historical data from event sources.
When completing an environment audit and preparing to deploy SIEM (InsightIDR) in your environment, keep the following in mind:
- [Log Data Storage and Retention]
- [Raw Data Processing]
- [Normalize Logs]
- [Prepare for Log Collection]
- [Data Archiving]
- [Collected Data by Event Source Category]
Log Data Storage and Retention
With the standard SIEM (InsightIDR) subscription, your log data is stored for 13 months. Logs that are ingested during that time period are retained and available for search, visualization, and investigations.
You can also activate Data Archiving in SIEM (InsightIDR) to store log data in your own private Amazon S3 bucket.
SIEM (InsightIDR) does not have any other limits on the amount of data that you can store. To learn more about data collection, storage, and retention, read our Data Storage and Retention FAQs.
Raw Data Processing
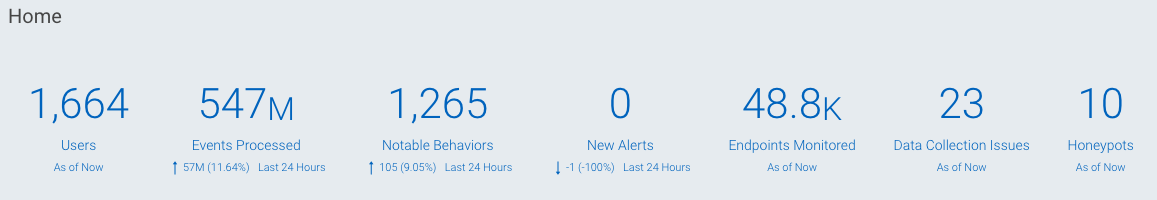
Before SIEM (InsightIDR) parses and normalizes data for user attribution, it populates the Events Processed KPI on your homepage. You can click on these KPIs to view more granular data and to query the collected log data.
Raw data is then parsed and normalized into user attribution data.
Credential Storage
Credentials are not stored in AWS. The Collector eliminates raw logs that are unnecessary to your environment and removes sensitive data from them. SIEM (InsightIDR) does not retain information such as personally identifiable information, medical records, or employee, organization, or asset names.
Normalize Logs
SIEM (InsightIDR) transforms, or normalizes, raw data into JSON in order to provide additional context around user behavior, compromised credentials, and other potentially malicious activity.
Normalization converts log data from multiple sources into a common JSON format and extracts standard information, such as hostnames, timestamps, error levels, and more. It also allows you to run advanced queries on your endpoint logs and enhance your data visualization. See Log Search for more information.
After normalization, SIEM (InsightIDR) correlates data between a single asset and a user in a process called “User Attribution.”
Unparsed Logs
When setting up event sources in SIEM (InsightIDR), you have the option to send unparsed data. By default, SIEM (InsightIDR) only processes and normalizes certain portions of logs according to defined parsing criteria for each event source. Activity that does not match SIEM (InsightIDR)’s existing parsing criteria is omitted, meaning it is not made available in Log Search. To send these additional log entries to SIEM (InsightIDR), you must choose to send unparsed data.
For example, when firewall activity is ingested, SIEM (InsightIDR) will only process activity that indicates connections are being made through the firewall. However, these logs can contain many other types of activity depending on the device, which will not match the defined criteria. You can elect to send this additional activity when setting up your firewall event sources.
To send unparsed logs:
- Set up a new event source by navigating to Data Collection and clicking Setup Event Source > Add Event Source. To find set-up instructions, review the documentation specific to your event source.
- On the Add Event Source page, select the checkbox to Send Unparsed Data.
After your event source is configured, logs appear in Log Search in the Unparsed Data log set. You can then use these logs to create basic detection rules, set up dashboards and reports, and apply custom parsing rules.
Use of this feature can exceed storage limits
If you allow the ingestion of unparsed data on high-volume event sources, you may exceed your storage limits. To check your monthly usage trends, navigate to Settings > Monthly Data Usage.
Prepare for Log Collection
Because most event source applications send data as syslog, you must configure each appliance to send data to the Collector on a unique TCP or UDP port.
See Collector Requirements for specific Collector port information. Otherwise, see Ports Used by SIEM (InsightIDR).
Timezones
When configuring an event source, it is important that you select the time that matches the time zone of the application sending the data, which often matches the physical location of the application, or is set to UTC.
If time zones do not match, SIEM (InsightIDR) may apply the wrong timestamp which will appear as mislabeled logs in log search or alerts.
To check the timestamp of your logs:
- Select the Data Collection page from the left menu and select the Event Sources tab.
- Find your event source and click the View raw log link.
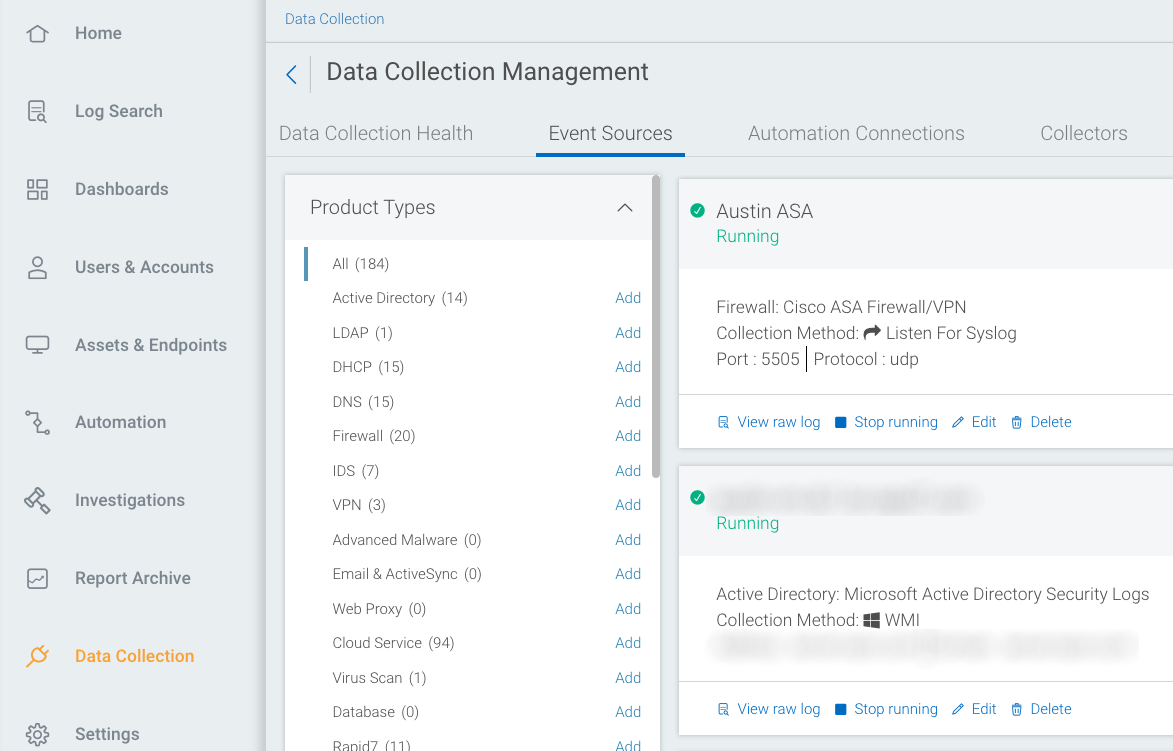
- If you need to correct the time zone or discover your logs do not have a time zone, click the Edit link on the running event source.
- Choose the correct timezone from the “Timezone” dropdown.
- Click the Save button.
Logs without a time stamp
If you discover that your logs do not have a timestamp, you should reconfigure your application to send logs in a format that include a timestamp, such as syslog.
Data Archiving
You can archive your log data to an Amazon S3 bucket, either on a daily basis or in a single bulk action, known as historical data archiving. This ensures that your data is backed up and preserved outside of SIEM (InsightIDR).
For more information, see Data Archiving.
Collected Data by Event Source Category
SIEM (InsightIDR) uses multiple event sources to collect the data it needs to protect your environment and help you quickly detect and respond to malicious activity on your network. The following table displays what categorical information is collected by specific event sources:
| Collected Data | Event Source(s) |
|---|---|
| User Details | Microsoft Active Directory, LDAP server logs, Rapid7 Metasploit, Virus scanner, VPN, and Endpoint Monitor |
| Asset Details | Microsoft Active Directory security logs and the DHCP server logs, Nexpose, and Endpoint Monitor |
| IP Address History | Microsoft Active Directory security logs, DHCP server logs |
| Location | VPN server logs, Cloud services for example, Cloud services (e.g. AWS, Box.com), and Microsoft ActiveSync |
| Services | DNS server logs, firewall, Web proxy, Cloud service - Box.com, Okta, Salesforce, and the Microsoft ActiveSync servers |
| Incidents | Microsoft Active Directory security logs, DHCP server logs, endpoint monitor, VPN servers (IP address ranges), DNS server logs, Firewall, and the Web proxy |
| Threats | DNS server logs, Firewall, and the Web proxy |
Active Directory
The Collector pulls the following fields from Active Directory event sources:
- Timestamp
- Action
- Source User
- Source Account
- Target User
- Target Account
- Group
- Group Scope
- Group Domain
Advanced Malware Detection
The Collector pulls the following fields from Advanced Malware Detection event sources:
- Timestamp
- Asset
- Secondary Asset
- Destination User
- Source User
- Source Address
- Destination Address
- Alert Name
- Source Port
- Destination Port
- Device Address
- Protocol
- Signature Name
- Severity
- GEOIP Organization
- GEOIP Country Code
- GEOIP Country Name
- GEOIP City
- GEOIP Region
Asset Authentication
The Collector pulls the following fields from Asset Authentication event sources:
- Timestamp
- Source Asset
- Destination Asset
- Source Asset Address
- Destination Asset Address
- Destination User
- Destination Account
- Destination Domain
- Destination Account SID
- Login Type
- Result
- New Authentication
- New Source Authentication
- New Source for Account
- Service
Cloud Service Administrator Activity
The Collector pulls the following fields from Cloud Service Administrator Activity event sources:
- Timestamp
- Service
- Action
- Source User
- Source Account
- Target User
- Target Account
DNS
The Collector pulls the following fields from DNS event sources:
- Timestamp
- Asset
- User
- Source Address
- Query
- Public Suffix
- Top Private Domain
File Access Activity
The Collector pulls the following fields from File Access Activity event sources:
- Timestamp
- User
- Account
- Account Domain
- Source Address
- Service
- Target Address
- File Path
- File Name
- File Extension
- File Share
- Access Type
Firewall Activity
The Collector pulls the following fields from Firewall Activity event sources:
- Timestamp
- Asset
- User
- Source Address
- Source Port
- Destination Address
- Destination Port
- Connection Status
- Direction
- GEOIP Organization
- GEOIP Country Code
- GEOIP Country Name
- GEOIP City
- GEOIP Region
Host to IP Observations
The Collector pulls the following fields from Host to IP Observation event sources:
- Timestamp
- Action
- HostID
- IP
- Observation Status
IDS Alerts
The Collector pulls the following fields from IDS Alert event sources:
- Timestamp
- Asset
- User
- Signature
- Source IP
- Destination
- Description
- Severity
- Protocol
- Generator ID
- Source Port
- Destination Port
Ingress Authentication (OWA/ActiveSync)
The Collector pulls the following fields from Ingress Authentication (OWA/ActiveSync) event sources:
- Timestamp
- User
- Account
- Result
- Source IP
- Service
- GEOIP Organization
- GEOIP Country Code
- GEOIP Country Name
- GEOIP City
- GEOIP Region
Raw Logs (Generic Syslog and Windows Event Log)
The Collector pulls the following fields from Raw Log (Generic Syslog and Windows Event Log) event sources:
- Timestamp
- Host Name
- Event Code
- Description
- Package Name
- Target User Name
- Workstation
- Status
SSO Authentication
The Collector pulls the following fields from SSO Authentication event sources:
- Timestamp
- User
- Account
- Source IP
- Service
- SSO Provider
- GEOIP Organization
- GEOIP Country Code
- GEOIP Country Name
- GEOIP City
- GEOIP Region
Virus Alert
The Collector pulls the following fields from Virus Alert event sources:
- Timestamp
- Asset
- User
- Account Domain
- Risk
- Action