McAfee IDS
McAfee IPS/IDS, or McAfee Network Security Platform, McAfee monitors your network for intrusions and malicious activity.
Before You Begin
McAfee IDS will produce two types of logs: firewall events and IPS events. You must configure McAfee to send only its IPS events to SIEM (InsightIDR) as syslog.
To configure IPS events as syslog:
- Enable syslog on the appliance to forward IPS events and alerts. Learn how to do so here: https://docs.mcafee.com/bundle/network-security-platform-9.2.x-product-guide/page/GUID-E4A687B0-FAFB-4170-AC94-1D968A10380F.html
- Add a syslog server profile. Learn how to do so here: https://docs.mcafee.com/bundle/network-security-platform-9.2.x-product-guide/page/GUID-8C7F8174-1BFB-4455-B5DD-87921253C4B8.html
- Edit the syslog message to be in an acceptable format for SIEM (InsightIDR). Learn how to do so here: https://docs.mcafee.com/bundle/network-security-platform-9.2.x-product-guide/page/GUID-496EC0F4-BE90-4401-A218-88FD9B72D040.html
The original IPS format looks like this:
<162>Nov 9 13:01:03 SyslogAlertForwarder: FOW-DMZ-IPS1 detected Outbound attack SNMP: Microsoft V2 Bulk Request ValueList Overflow (severity = High). 10.251.33.35:N/A -> 192.168.83.1:N/A (result = Smart Blocked)- Change the IPS format to look like the following:
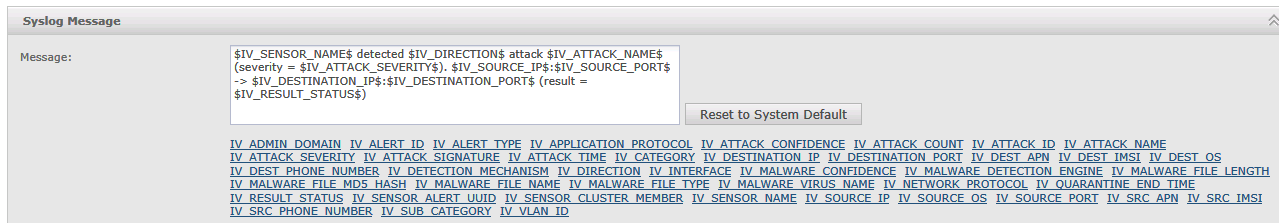
$IV_SENSOR_NAME$ detected $IV_DIRECTION$ attack $IV_ATTACK_NAME$ attack_id $IV_ATTACK_ID$ (severity = $IV_ATTACK_SEVERITY$). $IV_SOURCE_IP$:$IV_SOURCE_PORT$ -> $IV_DESTINATION_IP$:$IV_DESTINATION_PORT$ (result = $IV_RESULT_STATUS$)- Click Save to finalize the customization of your syslog message.
Configure SIEM (InsightIDR) to collect data from the event source
After you complete the prerequisite steps and configure the event source to send data, you must add the event source in SIEM (InsightIDR).
To configure the new event source in SIEM (InsightIDR):
- From the left menu, go to Data Collection and click Setup Event Source > Add Event Source.
- Do one of the following:
- Search for McAfee IDS in the event sources search bar.
- In the Product Type filter, select IDS.
- Select the McAfee IDS event source tile.
- Choose your collector and event source. You can also name your event source if you want.
- Choose the timezone that matches the location of your event source logs.
- Optionally choose to send unparsed logs.
- Select Listen on Network Port and specify a port and protocol. The default port is 514.
- Optionally choose to Encrypt the event source if choosing TCP by downloading the Rapid7 Certificate.
- Click Save.