Risk Strategies

To calculate risk, you can select or create a risk strategy to help you understand the impact of vulnerabilities to your organization. Each strategy focuses on certain characteristics, allowing you to analyze risk according to your organization’s unique security needs or objectives.

  • Vulnerability characteristics indicate how easy it is to exploit and what an attacker can do to your environment after performing an exploit. These characteristics make up the vulnerability’s risk to your organization.
  • Assets also have risk associated with them, based on how sensitive it is to your organization’s security. For example, if a database that contains credit card numbers is compromised, the damage to your organization will be significantly greater than if a printer server is compromised.

After you select a risk strategy you can do the following:

  • Sort how vulnerabilities appear according to risk. By sorting vulnerabilities you can make a quick visual determination as to which vulnerabilities need your immediate attention and which are less critical.
  • View risk trends over time in reports, which allows you to track progress in your remediation effort or determine whether risk is increasing or decreasing over time in different segments of your network.

Comparing risk strategies

Each risk strategy is based on a formula in which factors such as likelihood of compromise, impact of compromise, and asset importance are calculated. Each formula produces a different range of numeric values. For example, the Active Risk strategy produces a maximum score of 1,000, while the Temporal strategy has no upper bounds, with some high-risk vulnerability scores reaching the hundred thousands. This is important to keep in mind if you apply different risk strategies to different segments of scan data. Refer to Changing your risk strategy.

Many of the available risk strategies use the same factors in assessing risk, each strategy evaluating and aggregating the relevant factors in different ways. The common risk factors are grouped into three categories: vulnerability impact, initial exploit difficulty, and threat exposure. The factors that comprise vulnerability impact and initial exploit difficulty are the six base metrics employed in version 2 of the Common Vulnerability Scoring System (CVSS), though the base metrics employed for Active Risk are based on CVSSv3.

  • Vulnerability impact is a measure of what can be compromised on an asset when attacking it through the vulnerability, and the degree of that compromise. Impact is comprised of three factors:
    • Confidentiality impact - indicates the disclosure of data to unauthorized individuals or systems.
    • Integrity impact - indicates unauthorized data modification.
    • Availability impact - indicates loss of access to an asset's data.
  • Initial exploit difficulty is a measure of likelihood of a successful attack through the vulnerability, and is comprised of three factors:
    • Attack vector - indicates how close an attacker needs to be to an asset in order to exploit the vulnerability. If the attacker must have local access, the risk level is low. Lesser required proximity corresponds to higher risk.
    • Attack complexity - is the likelihood of exploit based on the ease or difficulty of perpetrating the exploit, both in terms of the skill required and the circumstances which must exist in order for the exploit to be feasible. Lower access complexity corresponds to higher risk.
    • Authentication requirement - is the likelihood of exploit based on the number of times an attacker must authenticate in order to exploit the vulnerability. Fewer required authentications map to higher risk.
  • Threat exposure includes three variables:
    • Vulnerability age - is a measure of how long the security community has known about the vulnerability. The longer a vulnerability has been known to exist, the more likely that the threat community has devised a means of exploiting it and the more likely an asset will encounter an attack that targets the vulnerability. Older vulnerability age corresponds to higher risk.
    • Exploit exposure - is the rank of the highest-ranked exploit for a vulnerability, according to the Metasploit Framework. This ranking measures how easily and consistently a known exploit can compromise a vulnerable asset. Higher exploit exposure corresponds to higher risk.
    • Malware exposure - is a measure of the prevalence of any malware kits, also known as exploit kits, associated with a vulnerability. Developers create such kits to make it easier for attackers to write and deploy malicious code for attacking targets through the associated vulnerabilities.

Review the summary of each model before making a selection.

Active Risk strategy

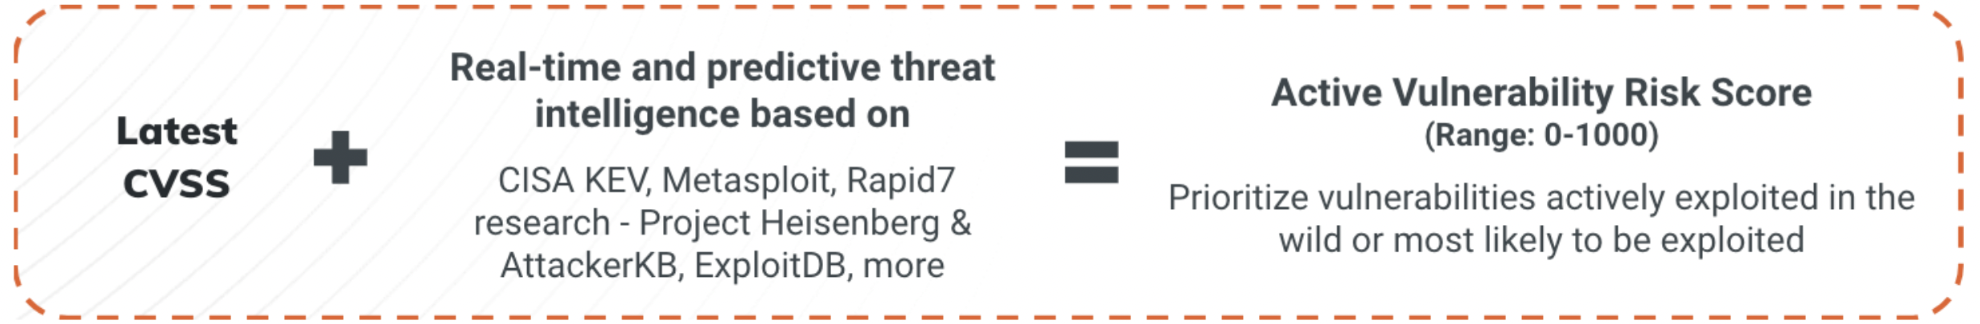
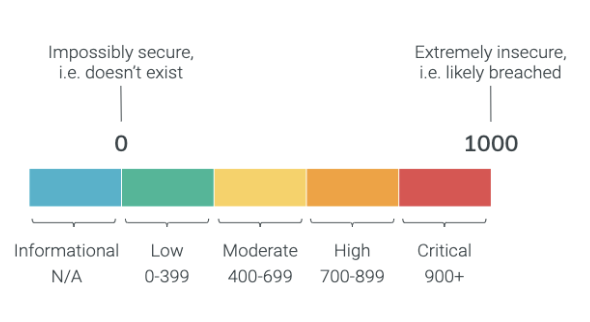
Active Risk is Rapid7’s recommended built-in strategy for assessing and analyzing vulnerability risk on a scale of 0-1000. Active Risk uses the latest CVSS score with intelligence from threat feeds like AttackerKB, Metasploit, ExploitDB, Project Lorelei, CISA KEV list, and other third-party dark web sources to provide security teams with a threat-aware vulnerability risk score and to help prioritize remediation for the most critical vulnerabilities.

Active Risk vulnerability score overview

To determine likelihood and impact, the Active Risk algorithm applies unique exploit and malware exposure metrics for each vulnerability which is then compounded with CVSS base metrics.

Active Risk is computed using the latest version of CVSS metrics

Active Risk uses the latest CVSS version available for a vulnerability when calculating the risk score. Active Risk will use a CVSSv3.1 score if it is available, and if not, it will use the next most recent version available such as CVSSv3 or CVSSv2.

Vulnerability risk score scale

In contrast to traditional CVSS scores that use a 1-10 system, this algorithm allows for greater incrementation throughout our risk score assessments. Thousands of vulnerabilities may have a CVSS score of 10, making it difficult to determine remediation priorities.

How does Active Risk's scoring algorithm work?

The model computes a maximum impact between 0 and 1000 based on the following vulnerability attributes:

AttributeDescription
CVSS scoreThe Common Vulnerability Scoring System (CVSS) standard assesses individual vulnerabilities on a scale of 0.0 to 10.0 using a variety of metrics.

By default, ERV uses v3 scores where available, otherwise v2 scores are used instead. For zero day scenarios where a CVSS score has not yet been assigned but exploitation in the wild has been observed, the CVSS score is not considered.
ExploitabilityIf an exploit or exploit kit exists for a vulnerability. Sources: Metasploit and ExploitDB.

“Exploitation” is a cybersecurity term for the ability to leverage an attack on a vulnerability by hackers. Read our blog for more information.
Exploited in the WildIf a vulnerability has been actively targeted by attackers in the real world. Sources: Rapid7 Research, CISA KEV, and 3rd Party Feeds.

“Exploited in The Wild” is a cybersecurity term for malware that is actively being used by attackers (“exploited”) and can be found on devices belonging to ordinary users (“in-the-Wild”).
AttackerKBAn expert assessment for how valuable a vulnerability is to an attacker and how easily exploitable is a vulnerability in real environments.
ExceptionsIf a vulnerability exception has been applied in InsightVM.

An exception is accepted risk for a vulnerability.

If a vulnerability has been disclosed, but a CVSS score has not yet been published, a default CVSS score of 4.4 will be used in the risk score calculation.

After you've selected Active Risk as your strategy, use the Vulnerability Findings by Active Risk Score Severity and Vulnerability Findings by Active Risk Score Severity and Publish Age dashboard cards to view your active risks.

Temporal strategy

This strategy emphasizes the length of time that the vulnerability has been known to exist, so it could be useful for prioritizing older vulnerabilities for remediation. Older vulnerabilities are regarded as likelier to be exploited because attackers have known about them for a longer period of time. Also, the longer a vulnerability has been in an existence, the greater the chance that less commonly known exploits exist.

The Temporal risk strategy aggregates proximity-based impact of the vulnerability, using confidentiality impact, integrity impact, and availability impact in conjunction with access vector. The impact is tempered by dividing by an aggregation of the exploit difficulty metrics, which are access complexity and authentication requirement. The risk then grows over time with the vulnerability age.

The Temporal strategy has no upper bounds. Some high-risk vulnerability scores reach the hundred thousands.

TemporalPlus strategy

Like the Temporal strategy, TemporalPlus emphasizes the length of time that the vulnerability has been known to exist. However, it provides a more granular analysis of vulnerability impact by expanding the risk contribution of partial impact vectors.

The TemporalPlus risk strategy aggregates proximity-based impact of the vulnerability, using confidentiality impact, integrity impact, and availability impact in conjunction with access vector. The impact is tempered by an aggregation of the exploit difficulty metrics, which are access complexity and authentication requirement. The risk then grows over time with the vulnerability age.

The TemporalPlus strategy has no upper bounds. Some high-risk vulnerability scores reaching the hundred thousands.

This strategy distinguishes risk associated with vulnerabilities with “partial” impact values from risk associated with vulnerabilities with “none” impact values for the same vectors. This is especially important to keep in mind if you switch to TemporalPlus from the Temporal strategy, which treats them equally. Making this switch will increase the risk scores for many vulnerabilities already detected in your environment.

Weighted strategy

The Weighted strategy can be useful if you assign levels of importance to sites or if you want to assess risk associated with services running on target assets. The strategy is based primarily on site importance, asset data, and vulnerability types, and it emphasizes the following factors:

  • Vulnerability severity, which is the number—ranging from 1 to 10—that the application calculates for each vulnerability
  • Number of vulnerability instances
  • Number and types of services on the asset; for example, a database has higher business value
  • The level of importance, or weight, that you assign to a site when you configure it; see Configuring a site using a Dynamic Discovery connection or Getting started: Info & Security.
  • Weighted risk scores scale with the number of vulnerabilities. A higher number of vulnerabilities on an asset means a higher risk score. The score is expressed in single- or double-digit numbers with decimals.

PCI ASV 2.0 Risk strategy

The PCI ASV 2.0 Risk strategy applies a score based on the Payment Card Industry Data Security Standard (PCI DSS) Version 2.0 to every discovered vulnerability. The scale ranges from 1 (lowest severity) to 5 (highest severity). With this model, Approved Scan Vendors (ASVs) and other users can assess risk from a PCI perspective by sorting vulnerabilities based on PCI 2.0 scores and viewing these scores in PCI reports. Also, the five-point severity scale provides a simple way for your organization to assess risk at a glance.

Changing your risk strategy

Active Risk can't be changed back to Real Risk or recalculated with historical data

You are not able to change your risk strategy to Real Risk after selecting Active Risk, even if it was your previous risk strategy. Rapid7 will soon stop support of Real Risk in favor of the Active Risk strategy. Additionally, historical data cannot be recalculated with Active Risk as it is not available.

You may choose to change the current risk strategy to get a different perspective on the risk in your environment:

  1. In the Security Console, click Administration > Risk Score Settings > Risk Strategy.
  2. Click the arrow of any risk strategy to view information about it. Information includes a description of the strategy and its calculated factors, the strategy’s source (built-in or custom), and how long it has been in use if it is the currently selected strategy.
  3. Select the radio button for the risk strategy you want to change to.
  4. Click Save.

(Optional) View risk strategy usage history

This allows you to see how different risk strategies have been applied to all of your scan data. It also is useful for determining why segments of risk trend data appear inconsistent.

  1. Under the Risk Strategies Usage section, click the Current Usage tab.

  2. In the Current Usage tab, view all the risk strategies that are currently applied to your entire scan data set.

    The Status column indicates whether any calculations did not complete successfully.

  3. Click the Change Audit tab to view every modification of risk strategy usage in the history of your installation.

    The table in this section lists every instance that a different risk strategy was applied, the affected date range, and the user who made the change. This information may also be useful for troubleshooting risk trend inconsistencies or for other purposes.

  4. (Optional) Click the Export to CSV icon to export the change audit information to CSV format, which you can use in a spreadsheet for internal purposes.

Using custom risk strategies

You may want to calculate risk scores with a custom strategy that analyzes risk from perspectives that are very specific to your organization’s security goals. You can create a custom strategy and use it in InsightVM.

Each risk strategy is an XML document. It requires the RiskModel element, which contains the ID attribute, a unique internal identifier for the custom strategy.

RiskModel contains the following required sub-elements:

  • Name - This is the name of the strategy as it will appear in the Risk Strategies page of the Web interface. The datatype is xs:string.
  • Description - This is the description of the strategy as it will appear in the Risk Strategies page of the Web interface. The datatype is xs:string.
  • VulnerabilityRiskStrategy - This sub-element contains the mathematical formula for the strategy. It is recommended that you refer to the XML files of the built-in strategies as models for the structure and content of the VulnerabilityRiskStrategy sub-element.

A custom risk strategy XML file contains the following structure:

1
<?xml version="1.0" encoding="UTF-8" standalone="yes"?>
2
<RiskModel id="custom_risk_strategy">
3
<name>Primary custom risk strategy</name>
4
<description>
5
This custom risk strategy emphasizes a number of important factors.
6
</description>
7
<VulnerabilityRiskStrategy>
8
[formula]
9
</VulnerabilityRiskStrategy>
10
</RiskModel>

Review your custom strategy XML file

Make sure that your custom strategy XML file is well-formed and contains all required elements to ensure that the application performs as expected.

Make a custom risk strategy available in InsightVM

  1. Copy your custom XML file into the directory [installation_directory]/shared/riskStrategies/custom/global.
  2. Restart the Security Console.

The custom strategy appears at the top of the list on the Risk Strategies page.

Setting the appearance order for a risk strategy

To set the order for a risk strategy, add the optional order sub-element with a number greater than 0 specified, as in the following example. Specifying a 0 would cause the strategy to appear last.

1
<?xml version="1.0" encoding="UTF-8" standalone="yes"?>
2
<RiskModel id="janes_risk_strategy">
3
<name>Jane’s custom risk strategy</name>
4
<description>
5
Jane’s custom risk strategy emphasizes factors important to Jane.
6
</description>
7
<order>1</order>
8
<VulnerabilityRiskStrategy>
9
[formula]
10
</VulnerabilityRiskStrategy>
11
</RiskModel>

Set the appearance order

  1. Open the wanted risk strategy XML file, which appears in one of the following directories:
    • [installation_directory]/shared/riskStrategies/custom/global - for a custom strategy
    • [installation_directory]/shared/riskStrategies/builtin - for a built-in strategy
  2. Add the order sub-element with a specified numeral to the file.
  3. Save and close the file.
  4. Restart the Security Console.

Changing the appearance order of risk strategies

You can change the order of how risk strategies are listed on the Risk Strategies page. This could be useful if you have many strategies listed and you want the most frequently used ones listed near the top. To change the order, you assign an order number to each individual strategy using the optional order element in the risk strategy’s XML file. This is a sub-element of the RiskModel element. See Using custom risk strategies.

For example, three people in your organization create custom risk strategies: Jane’s Risk Strategy, Tim’s Risk Strategy, and Terry’s Risk Strategy. You can assign each strategy an order number. You can also assign order numbers to built-in risk strategies.

A resulting order of appearance might be the following:

  • Jane’s Risk Strategy (1)
  • Tim’s Risk Strategy (2)
  • Terry’s Risk Strategy (3)
  • Active Risk (4)
  • TemporalPlus (5)
  • Temporal (6)
  • Weighted (7)

Order of strategies may reset

The order of built-in strategies will be reset to the default order with every product update.

Custom strategies always appear above built-in strategies. So, if you assign the same number to a custom strategy and a built-in strategy, or even if you assign a lower number to a built-in strategy, custom strategies always appear first.

If you do not assign a number to a risk strategy, it will appear at the bottom in its respective group (custom or built-in). In the following sample order, one custom strategy and two built-in strategies are numbered 1.

One custom strategy and one built-in strategy are not numbered:

  • Jane’s Risk Strategy (1)
  • Tim’s Risk Strategy (2)
  • Terry’s Risk Strategy (no number assigned)
  • Weighted (1)
  • Active Risk (1)
  • TemporalPlus (2)
  • Temporal (no number assigned)

Note that the custom strategy, Tim’s Risk Strategy, has a higher number than two numbered, built-in strategies; yet it appears above them.

Understanding how risk scoring works with scans

An asset goes through several phases of scanning before a completed status for that scan will display. An asset that has not gone through all the required scan phases has a status of in progress. InsightVM only calculates risk scores based on data from assets with completed scan status.

If a scan pauses or stops, The application does not use results from assets that do not have a completed status for the computation of risk scores. For example, 10 assets are scanned in parallel. Seven have completed scan status; three do not. The scan is stopped. Risk is calculated based on the results for the seven assets with completed status. For the three in progress assets, it uses data from the last completed scan.

To determine scan status consult the scan log. See Viewing the scan log.