Search Your Logs
Once you configure Core Event Sources, go to the Log Search page from the SIEM (InsightIDR) homepage to search your logs, visualize your data, and create basic detection rules.
Your connected event sources and environment systems produce data in the form of raw logs. Log Search takes every log of raw data and automatically sorts them into log sets for you.
Step 1: Select logs or log sets to search
On the Log Search page, go to the Log Sources panel and select the logs or log sets you want to search.
If you are unsure about which log sets to select, read about the Log Sets You Can Search.
To send data into Log Search in a format that is not currently supported by the Platform, you can set up custom logs.
To parse logs in a format that is unknown to SIEM (InsightIDR), you can create custom parsing rules.
Step 2: Build a query
To search for specific log data, build a query using the Log Entries Query Language (LEQL). LEQL is the search language that allows you to build analytical queries.
Option 1: Generate a LEQL query using AI-powered Log Search
You can generate a query using AI-powered Log Search. Using this, you can enter a natural language prompt, for example All events where the user logged in from the United States, which will generate a suitable LEQL query you can use to query Log Search. You can click Populate LEQL Bar to add it to the query bar.
In addition to providing the query in response to your prompt, the system also provides an explanation of why the particular query was returned, including why specific functions or clauses were included.
Option 2: Manually write a LEQL query
As you write a LEQL query in Log Search, the query bar automatically suggests the elements of LEQL that you can use in your query. To exit the suggestions, press the escape key, and then the enter key to run the query. Try grouping your data using the groupby() clause to easily spot patterns in your results.
To begin learning the basics of LEQL, you can try recreating one of our example queries.
Step 3: View the resulting log entries
Depending on the type of query you run, the results display either in the Data tab, the Analysis tab, or both. A LEQL query that uses analytic functions displays its results in the Analysis tab.
The available LEQL analytic functions are:
- Count:
count - Sum:
sum - Average:
average - Count unique:
unique - Minimum:
min - Maximum:
max - Timeslice:
timeslice - Percentile:
pctl - Bytes:
bytes - Standard Deviation:
standarddeviation
Tip for using the context menu
Select a clickable key or value to open the context menu. This menu allows you to quickly add a function, clause, key-value pair, or value to the query bar. By highlighting a specific value and using this menu, you can quickly enrich your queries and find specific data much more efficiently.
Reduce the number of groups returned when using the groupby() clause
The having() clause can be used to reduce the set of groups returned when using the groupby() clause. You can leverage calculation functions, such as sum, max, and unique within the having() clause to further specify the groups returned.
The having() clause is not supported in SIEM (InsightIDR) basic detection rules. However, you can set a threshold when you create a custom detection rule to identify repeated suspicious events in your environment.
Here is an example of the results that are returned by a single groupby() query:
Example groupby() query:
where(result=FAILED_BAD_PASSWORD) groupby(user)
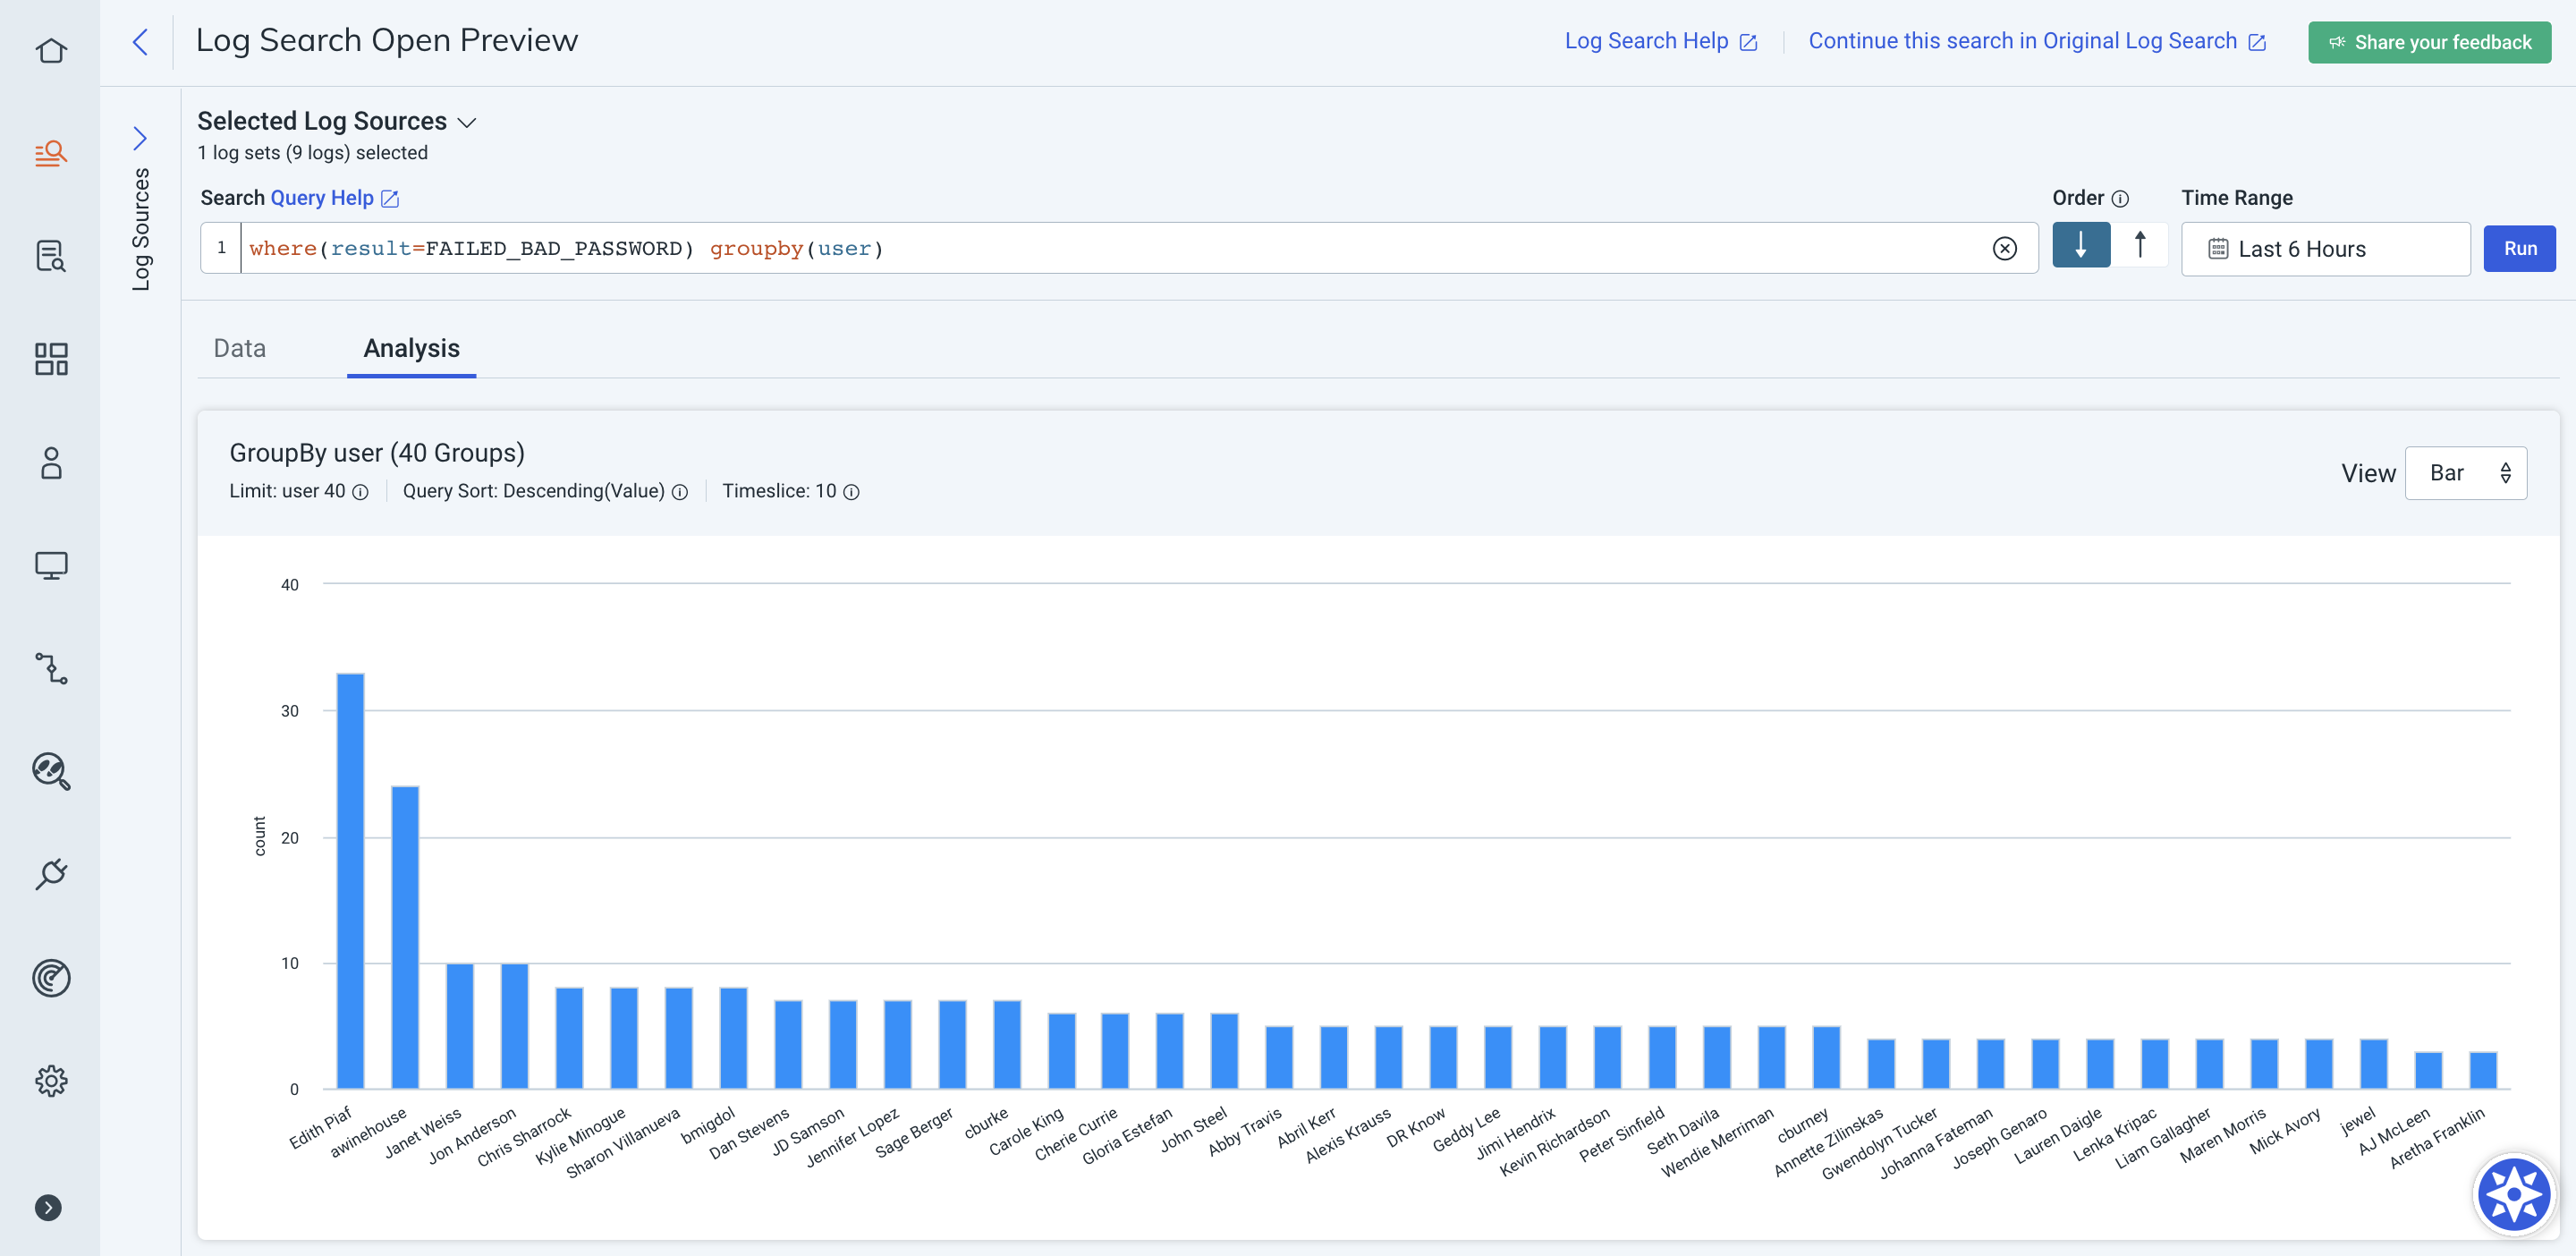
This query includes all users who have failed to log in within the specified time range, including those users who only failed once.
Example groupby() query with the having clause:
where(result=FAILED_BAD_PASSWORD) groupby(user) having (count>5)
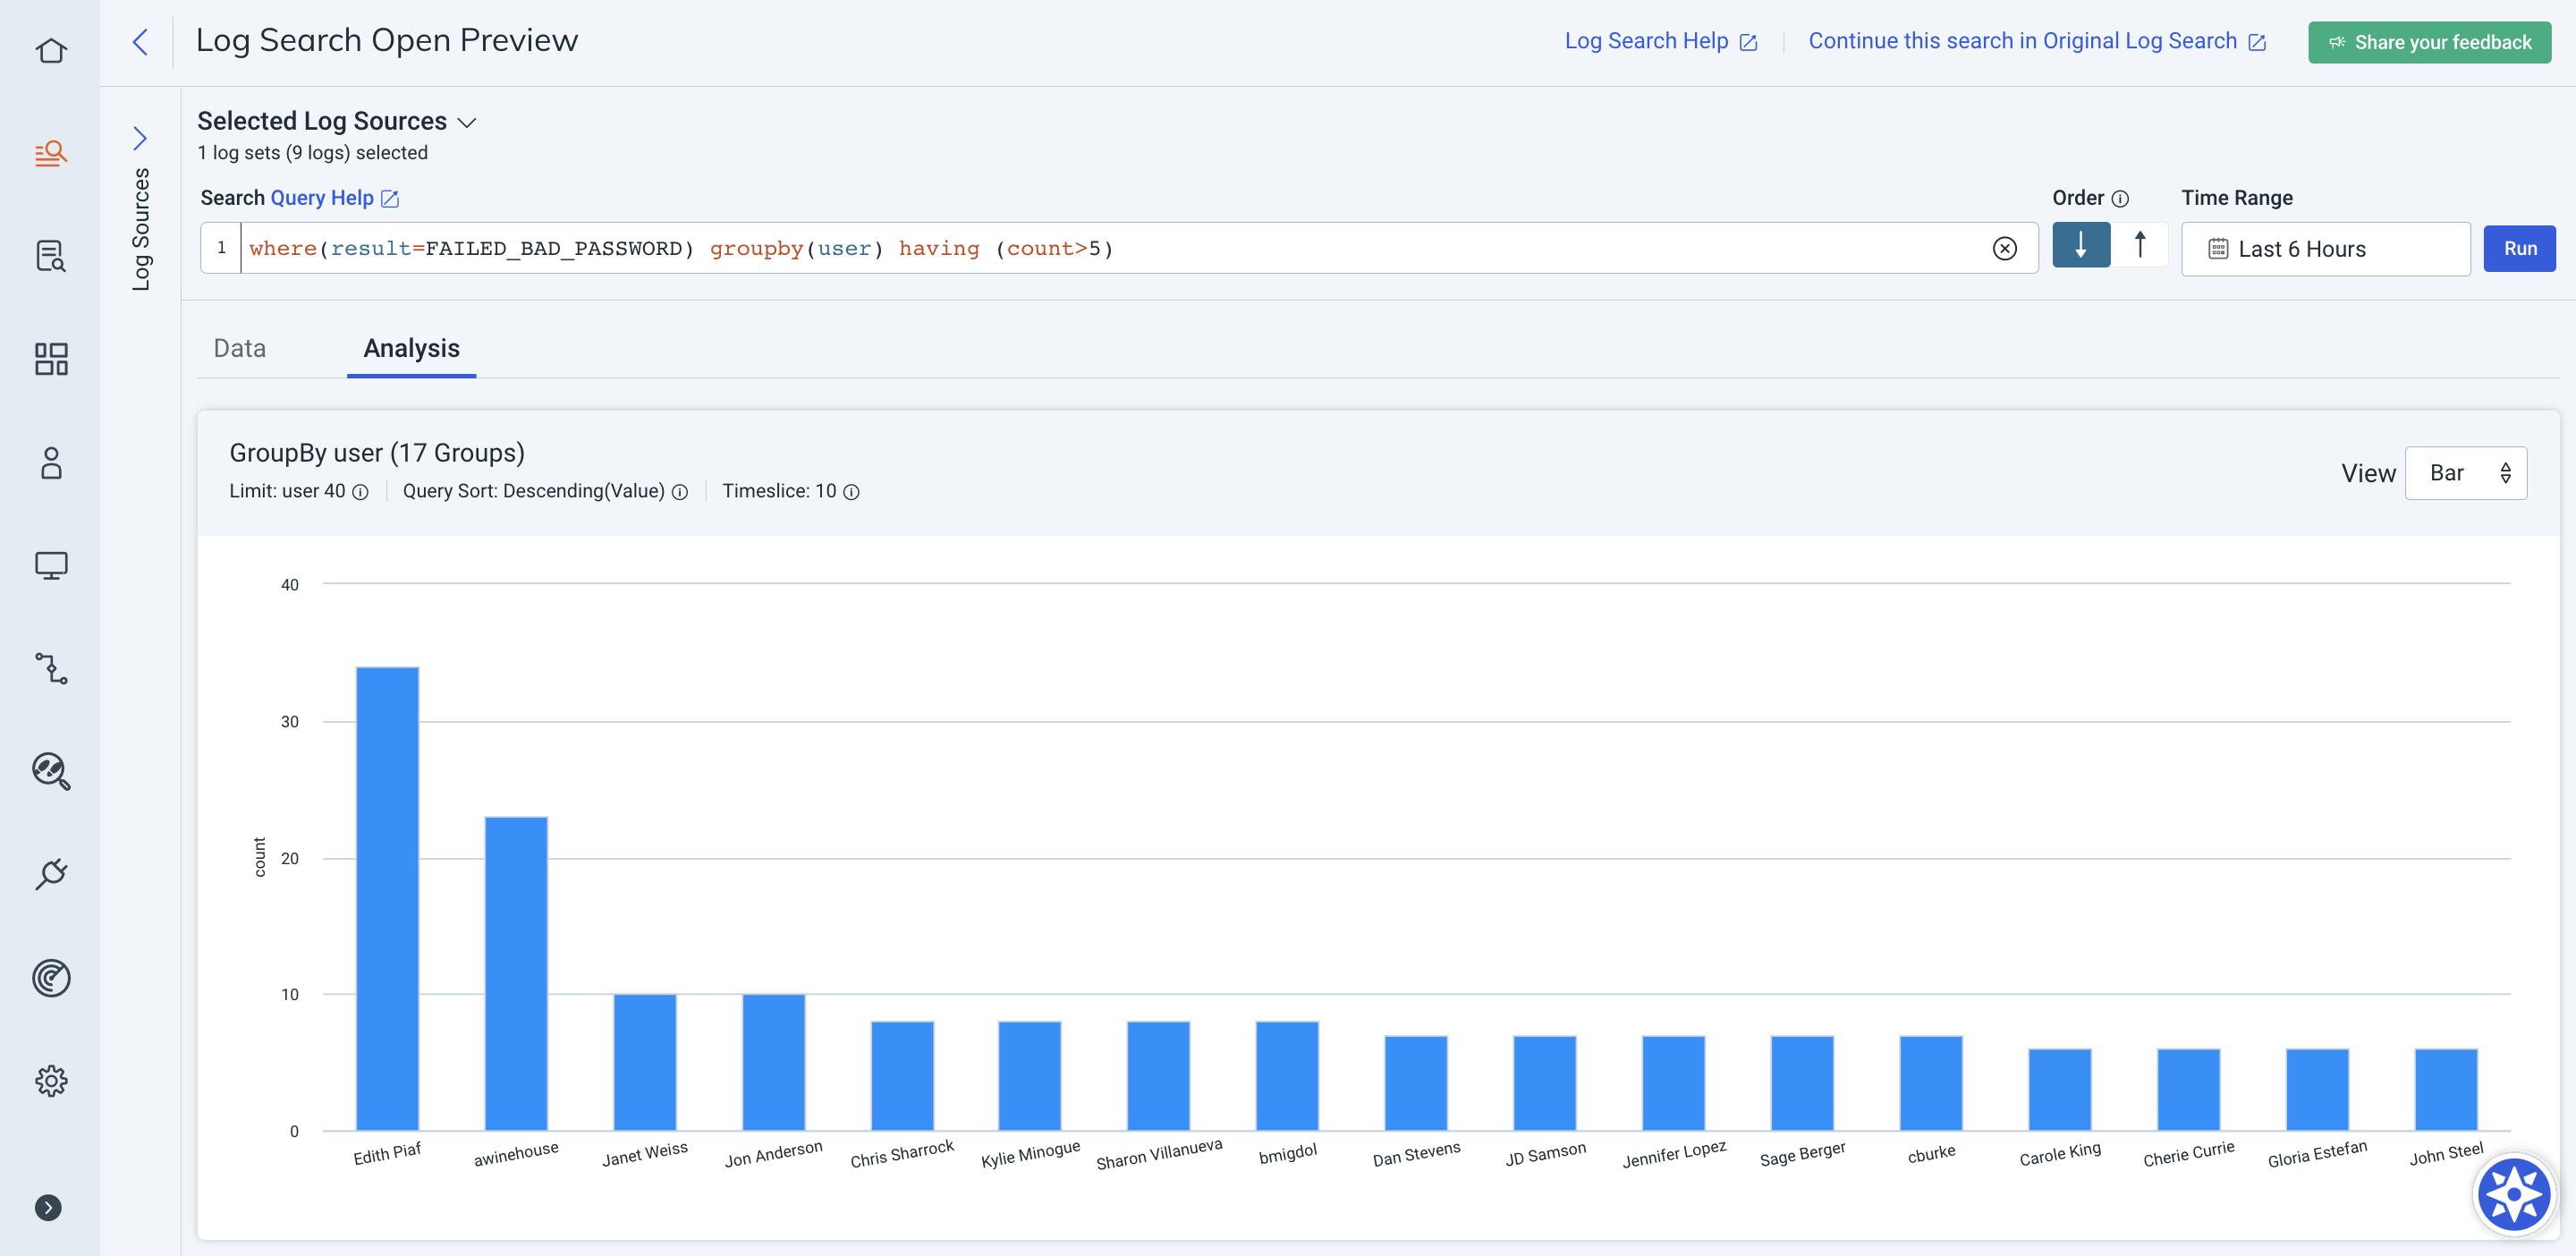
This query includes users who failed to log in more than 200 times. Any users who failed to log in less than 200 times will not be included in this query’s results and could be interpreted as benign.
By default, Log Search orders your query results by most recent ingestion time first. Click the Order arrows to the right of the query bar to change the order of your query results. Log Search will persist your order selection for future logins.
Alternatively, you can use the sort() clause to change the order of your results:
sort(desc)orsort(descending)sort(asc)orsort(ascending)
To sort by the name of the group instead of the value, include either sort(asc#key) or sort(desc#key) in your query.
If you are grouping by multiple keys, then you can pass in additional sorting criteria. Read more about multi-groupby queries.
Example
This query sorts the results first by the count of the destination_user key in ascending order, and then result key in descending order.
groupby(destination_user, result) calculate(count) sort(asc, desc#key)Step 4: Create dashboards and visualizations (optional)
Create Dashboards for a holistic, visual understanding of your log data. Generate reports or export log data to share query results with your team.
Step 5: Create a Basic Detection Rule (optional)
Create a basic detection rule from specific log indicators, such as invalid logins.