Locating and working with assets
By viewing and sorting asset information based on their assessment status, you can get a clear picture of your environment and handle any security issues potentially affecting it.
To view all of the assessed and discovered assets that you have access to, click the Assets icon and open the Assets page.
You can view all of the assessed assets and sort them by address, name, site, operating system, or when they were last assessed. You can also check if they are flagged for risk, vulnerabilities, malware, or exploits.
Assets are classified as assessed after they have been scanned or when they have the Rapid7 Agent (Insight Agent) installed on them.
Assets are classified as unassessed if they were identified by a dynamic discovery connection, such as LDAP, Microsoft Azure, or AWS. These are discovered assets that have been assigned to a site but have not yet been assessed for vulnerabilities or policy compliance.
Easily manage assets with asset groups
While you can use the Assets page to view information about assessed and discovered assets, you can manage or delete assets more easily by creating asset groups. Asset groups also control the user permissions and determine who can view the full range of asset data.
View asset counts and statistics
At the top of the Assets page, the total number of assessed assets is displayed. You also have a view of the number of sites, asset groups, and tagged assets that you have access to.
Global Administrators have a view of the number of assets that are used according to your license’s asset limit.
Charts display aggregated information about your assets and allow you to interact with that data to prioritize your remediations.
| Chart | Description |
|---|---|
| Assessment Status | Displays the number of assets that have been assessed for vulnerabilities and policy compliance as well as those that have been discovered by a Dynamic Discovery connection. |
| Assets by Operating System | Displays the portion of assets running each operating system. You can hover your cursor over each section to view a count and percentage of each operating system. You can also click a section to drill down to a more detailed breakdown of that category. For more information, read Locating assets by operating systems. |
| Exploitable Assets by Skill Level | This bar chart displays the skill level required to exploit assets with vulnerabilities in your environment. Novice-level assets are the easiest to exploit, and are therefore the ones you should address most urgently. Assets are not counted more than once and are categorized according to the most exploitable vulnerability on the asset. For example, if an asset has a Novice-level vulnerability, two Intermediate-level vulnerabilities, and one Expert-level vulnerability, that asset will be grouped in the Novice category. Assets without any known exploits appear in the No Exploits bar. |
Other charts in the product
A similar Exploitable Assets by Skill Level pie chart appears on the Vulnerabilities page, but that chart classifies the individual vulnerabilities rather than the assets. For more information, read Working with vulnerabilities.
Manage discovered assets
If you use Dynamic Discovery, the Discovered tab on the Assets page is important. This is where you can find the assets that have been discovered but are not yet assessed.
Assessing discovered assets is a good way to expose areas of your environment that have unknown security issues.
Before you begin, it is recommended that you enable asset linking to ensure there is no duplication of assets across sites.
After you create a site from your discovered assets and scan them for vulnerabilities or policy compliance, they are removed from the Discovered tab and displayed in the Assessed tab. They will count towards your license asset limit.
To assess discovered assets as a Global Administrator:
- From the navigation menu, open the Assets page.
- Go to the Discovered tab and click Export to CSV. The CSV file that contains the discovered assets is saved to your Downloads folder.
- From the top menu bar, click Create > Site. Follow the steps to create a site.
- On the Assets tab, go to the Include section and click Choose file. Fill out the remaining fields and then complete the other tabs in the site configuration.
- Click Save & Scan. After the scan completes, the assets from your discovery connection appear in the Assessed tab.
Locate assets by sites
To view assets by sites to which they have been assigned, click the hyperlinked number of sites displayed at the top of the Assets page. The Security Console displays the Sites page. From this page you can create a new site.
If a scan is in progress for any site, a column labeled Scan Status appears in the table. To view information about that scan, click the Scan in progress link. If no scans are in progress, a column labeled Last Scan appears in the table. Click the date link in the Last Scan column for any site to view information about the most recently completed discovery, vulnerability, or policy scans for that site.
Last Scan Time vs. Last Scan
The Last Scan Time column available in the Query Builder specifically refers to the last time the asset was assessed by an agent.
Site listing
Click the link for any site in the Site Listing pane to view its assets. The Security Console displays a page for that site, including recent scan information, statistical charts and graphs.
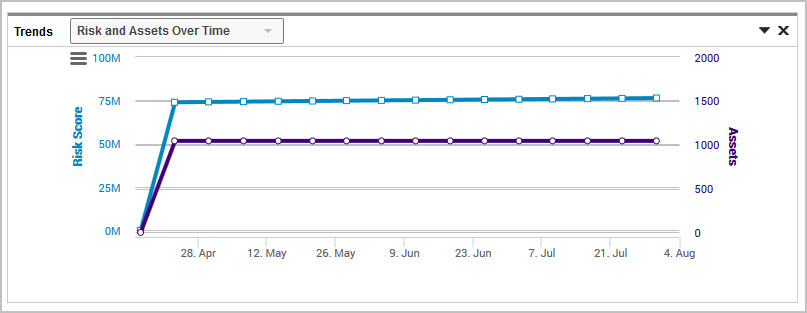
The Site Summary page displays trending chart as well as a scatter plot. The default selection for the trend chart matches the Home page – risk and assets over time.
You can also use the drop down menu to choose to view Vulnerabilities over time for this site. This vulnerabilities chart will populate with data starting from the time that you installed the August 6, 2014 product update. If you recently installed the update, the chart will show limited data now, but additional data will be gathered and displayed over time.
Scatter plot
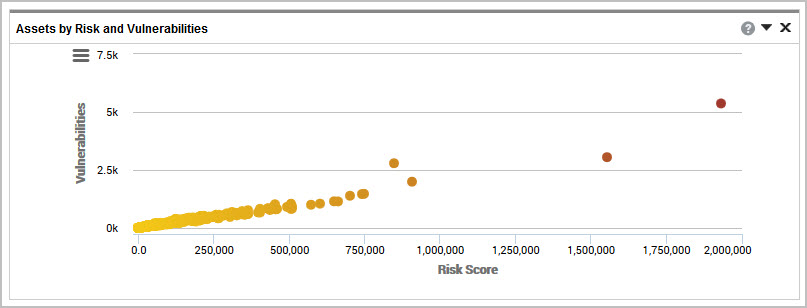
The scatter plot chart permits you to easily spot outliers so you can spot assets that have above average risk. Assets with the highest amount of risk and vulnerabilities will appear outside of the cluster. The position and colors also indicate the risk associated with the asset by the asset’s risk score - the further to the right and redder the color, the higher the risk. You can take action by selecting an asset directly from the chart, which will transfer you to the asset level view.
If a site has more than 7,000 assets, a bubble chart view first appears which allows you to select a group of assets to then refine your view by selecting a bubble and showing the scatter plot for that bubble.
Assessed Assets table
The Assessed Assets table no longer includes unassessed assets
As of April 9, 2025, the Assessed Assets table no longer contains unassessed assets that were found by LDAP, Microsoft Azure, or AWS dynamic discovery connections and are assigned to a site. To locate these assets, go to the Unassessed tab and view the Unassessed Assets table. This change may cause the total count of assets you once saw in the Assessed Assets table to be reduced. The total should now match the total number of assets at the top of the page, which reflects your license usage.
The Assessed Assets table shows the name and IP address of every assessed asset. If your site includes IPv4 and IPv6 addresses, the Address column groups these addresses separately. You can change the order of appearance for these address groups by clicking the sorting icon  in the Address column.
IP addresses are not listed for mobile devices. Instead the column displays the value Mobile device for each of these assets.
In the Assessed Assets table, you can view important security-related information about each asset to help you prioritize remediation projects: the number of available exploits, the number of vulnerabilities, and the risk score.
Unassessed Assets table
The Unassessed Assets table shows the name and IP address of every unassessed asset that was found by LDAP, Microsoft Azure, or AWS dynamic discovery connections.
These are discovered assets that have been assigned to a site but have not yet been assessed for vulnerabilities or policy compliance.
Asset details
From the details page of an asset, you can manage site assets and create site-level reports. You also can start a scan for that asset.
To view information about an asset listed in the Assessed Assets table, click the link for that asset. See Viewing the details about an asset.
Locate assets by asset groups
To view assets by asset groups in which they are included, click the hyperlinked number of asset groups displayed at the top of the Assets page. The Security Console displays the Asset Groups page.
Charts and graphs at the top of the Asset Groups page provide a statistical overview of asset groups, including risks and vulnerabilities. From this page you can create a new asset group. See Using asset groups to your advantage.
Click the link for any group in the Assessed Assets table to view its assets. The Security Console displays a page for that asset group, including statistical charts and graphs and a list of assets. In the Assets pane, you can view the scan, risk, and vulnerability information about any asset. You can click a link for the site to which the asset belongs to view information about the site. You also can click the link for any asset address to view information about it. See Viewing the details about an asset.
Locate assets by operating systems
To view assets by the operating systems running on them, see the Assets by Operating System chart or table on the Assets page.
Chart
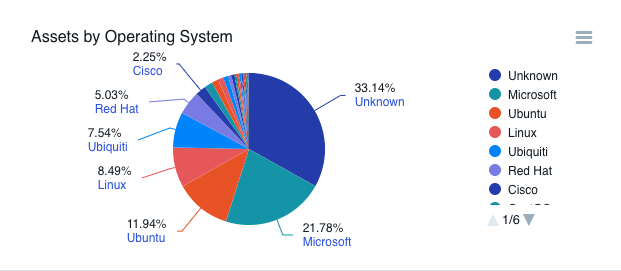
The Assets by Operating System pie chart offers drill down functionality, meaning you can select an operating system to view a further breakdown of the category selected. For example, if Microsoft is selected for the OS you will then see a listing of all Windows OS versions present, such as Windows Server 2008, Windows Server 2012, and so on. Continuing to click on wedges further breaks down the systems to specific editions and service packs, if applicable. A large number of unknowns in your chart indicates that those assets were not fingerprinted successfully and should be investigated.
If your assets have more than 10 types of operating systems, the chart shows the nine most frequently found operating systems, and an Other category. Click the Other wedge to see the remaining operating systems.
Table
The Operating System table lists all the operating systems running in your network and the number of instances of each operating system. Click the link for an operating system to view the assets that are running it.The Security Console displays a page that lists all the assets running that operating system. You can view scan, risk, and vulnerability information about any asset. You can click a link for the site to which the asset belongs to view information about the site. You also can click the link for any asset address to view information about it. See Viewing the details about an asset.
Locate assets by software
To view assets by the software running on them, see the Software table on the Assets page. The table lists any software that the application found running in your network, the number of instances of program, and the type of program.
The application only lists software for which it has credentials to scan. An exception to this would be when it discovers a vulnerability that permits root/admin access.
Click the link for a program to view the assets that are running it.
The Security Console displays a page that lists all the assets running that program. You can view scan, risk, and vulnerability information about any asset. You can click a link for the site to which the asset belongs to view information about the site. You also can click the link for any asset address or name to view information about it. See Viewing the details about an asset.
Locate assets by services
To view assets by the services they are running, see the Services table on the Assets page. The table lists all the services running in your network and the number of the number of instances of each service. Click the link for a service to view the assets that are running it. See Viewing the details about an asset.
View the details about an asset
Regardless of how you locate an asset, you can find out more information about it by clicking its name or IP address.
The Security Console displays a page for each asset determined to be unique. Upon discovering a live asset, Vulnerability Management uses correlation heuristics to identify whether the asset is unique within the site. Factors considered include:
- MAC address(es)
- host name(s)
- IP address
- virtual machine ID (if applicable)
- Network interfaces
Improved vulnerability correlation
On June 12, 2024, we released an improved vulnerability correlation algorithm in the Security Console which enables vulnerabilities to be identified on individual Network Interface Cards (NICs). You can now report on your assets with multiple NICs in more detail.
Due to the correlation improvements, you can expect your total vulnerability count to increase by 10% or more.
How did the Security Console identify vulnerabilities on assets with multiple NICs before this change?
The Security Console could only associate vulnerabilities to a single network interface. Before this change, the Security Console overwrote previous vulnerability results each time a new interface was scanned on the asset. This also created duplicate assets in the user interface.
Why might my vulnerability count and risk score increase with this change?
To prevent over-correlation of assets with multiple network interfaces, improvements to the correlation algorithm have been released. This may increase the number of vulnerabilities reported for assets with multiple network interfaces and therefore, increase overall vulnerability totals and risk score.
I’ve updated to the latest product version and now use the Multi-NIC feature, when should I expect to see NIC information in my environment?
You will see NIC information after your next authenticated vulnerability scan. NICs are discovered using vulnerability scans and correlated to an asset. Once a NIC is found, vulnerabilities are correlated at the NIC level.
Supported APIs
APIv4 (Integrations, ServiceNOW)
Supported OS
Windows assets with IPv4 addresses or hostnames that resolve to IPv4 addresses.
Linux assets with IPv4 addresses or hostnames that resolve to IPv4 addresses.
Supported scans
This feature only supports authenticated vulnerability scans.
What does this feature not support?
This feature doesn’t provide Multi-NIC support for the following:
- Data Warehouse
- IPv6 (only IPv4 is supported)
- APIv3
- Agent scanning and assessment
- Global IP search
Context
On the page for a discovered asset, you can view or add business context tags associated with that asset. For more information and instructions, see Applying RealContext with tags.
Assets with an installed Rapid7 Rapid7 Agent (Insight Agent) will display a corresponding icon. This indicates that the asset is part of the Rapid7 Rapid7 Agent (Insight Agent) site.
Trends
The asset Trend chart gives you the ability to view risk or vulnerabilities over time for this specific asset. Use the drop-down list to switch the view to risk or vulnerabilities.
Vulnerability listing
You can view the Vulnerability Listing table for any reported vulnerabilities and any vulnerabilities excluded from reports. The table lists any exploits or malware kits associated with vulnerabilities to help you prioritize remediation based on these exposures.
Additionally, the table displays a special icon for any vulnerability that has been validated with an exploit. If a vulnerability has been validated with an exploit via a Metasploit module, the column displays the  icon. If a vulnerability has been validated with an exploit published in the Exploit Database, the column displays the
  icon. For more information, see Working with validated vulnerabilities.
Additional details
You can also view information about software, services, policy listings, databases, files, and directories on that asset as discovered by the application. You can view any users or groups associated with the asset.
Asset properties
The Addresses field in the Asset Properties pane displays all addresses (separated by commas) that have been discovered for the asset. This may include addresses that have not been scanned. For example: A given asset may have an IPv4 address and an IPv6 address. When configuring scan targets for your site, you may have only been aware of the IPv4 address, so you included only that address to be scanned in the site configuration. Viewing the discovered IPv6 address on the asset page allows you to include it for future scans, increasing your security coverage.
You can view any asset fingerprints. Fingerprinting is a set of methods by which the application identifies as many details about the asset as possible. By inspecting properties such as the specific bit settings in reserved areas of a buffer, the timing of a response, or a unique acknowledgement interchange, it can identify indicators about the asset’s hardware and operating system.
In the Asset Properties table, you can run a scan or create a report for the asset.
The number of unique network interfaces associated with an asset are listed in Asset Properties. You can view the individual network interface cards in the Scan History, Asset History, and Services tables.
For more information about the Vulnerabilities Listing table and how you can use it, see Viewing active vulnerabilities and Working with vulnerability exceptions. The table lists different security metrics, such as CVSS rating, risk score, vulnerability publication date, and severity rating. You can sort vulnerabilities according to any of these metrics by clicking the column headings. Doing so allows you to order vulnerabilities according to these different metrics and get a quick view of your security posture and priorities.
If you have scanned the asset with Policy Manager Checks, you can view the results of those checks in the Policy Listing table. If you click the name of any listed policy, you can view more information about it, such as other assets that were tested against that policy or the results of compliance checks for individual rules that make up the policy. For more information, see Working with Policy Manager results.
If you have scanned the asset with standard policy checks, such as for Oracle or Lotus Domino, you can review the results of those checks in the Standard Policy Listing table.
Remediations
The Remediations panel shows lists of remediations that apply to the vulnerabilities on that asset. Selecting a link on one of the tabs leads to the specific instructions for remediating that item. The available tabs are:
- Best solutions: Akin to the top remediations plan for the asset as expressed in the Top Remediations report. It lists every remediation to be applied to the asset to fix all the vulnerabilities on the asset, but only lists the “best” solutions for the asset. (For example, if one of the remediations is to update an outdated operating system version, it may suggest the best of several possible patches that would address that issue.) Best is defined as the highest rollup (most recent or broad-reaching patch). If there are multiple candidates, this will generally be the most recent patch or most recent configuration change.
- Applicable solutions: Lists relevant remediations for the asset, without the selection of the best one. You may see multiple potential remediations related to the same vulnerabilities, so you can view the information available to the application when it made the determination of the best one.
- Solutions by vulnerability: This tab displays links to the solutions by which vulnerability they address, so you can focus your activity on addressing specific vulnerabilities.
You can also select a specific vulnerability from the Vulnerabilities table to view details about it as they relate to that specific asset. The Remediations section includes a table that displays tabs ordered from most to least precise in relevance to that asset. The available tabs are:
- Asset best solutions: The single best solution for this vulnerability with applicability and supersedence relevant to this asset.
- Asset applicable solutions: Available solutions for the vulnerability that were not determined to be the best, in case it makes sense in your environment to investigate other possible options.
- Solutions by Vulnerability: The general, non-asset-specific full list of solutions for this vulnerability as shown on the details page for the vulnerability. See Viewing vulnerability details.
Deleting assets
You may want to delete assets for one of several reasons:
- Assets may no longer be active in your network.
- Assets may have dynamic IP addresses that are constantly changing. If a scan on a particular date “rediscovered” these assets, you may want to delete assets scanned on that date.
- Network misconfigurations result in higher asset counts. If results from a scan on a particular date reflect misconfigurations, you may want to delete assets scanned on that date.
If any of the preceding situations apply to your environment, a best practice is to create a dynamic asset group based on a scan date. See Working with asset groups. Then you can locate the assets in that group using the steps described in Locating and working with assets. Using the bulk asset deletion feature described in this topic, you can delete multiple inactive assets in one step.
If you delete an asset from a site, it will no longer be included in the site or any asset groups in which it was previously included. If you delete an asset from an asset group, it will also be deleted from the site that contained it, as well as any other asset groups in which it was previously included. The deleted asset will no longer appear in the Web interface or reports other than historical reports, such as trend reports. If the asset is rediscovered in a future scan it will be regarded in the Web interface and future reports as a new asset.
Deleting an asset from an asset group is different from removing an asset from an asset group. The latter is performed in asset group management. See Working with asset groups.
Delete assets from the Assessed Assets table
You can only delete assets in sites or asset groups to which you have access.
To delete individual assets that you locate by using the site or asset group drill-down, take the following steps:
- After locating assets you want to delete, select the row for each asset in the Assessed Assets table.
- Click Delete Assets.
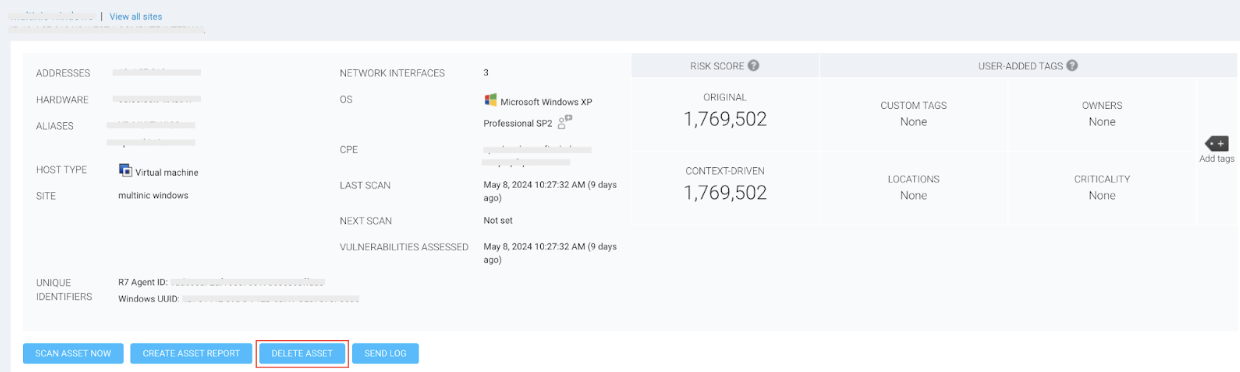
Delete individual assets from the Asset Details page
To delete individual assets that you are viewing by using the drill-down described in Viewing the details about an asset, take the following steps:
- After locating assets you want to delete, click the row for the asset in the Assessed Assets table to go to the Asset Details page.
- Click Delete Assets.
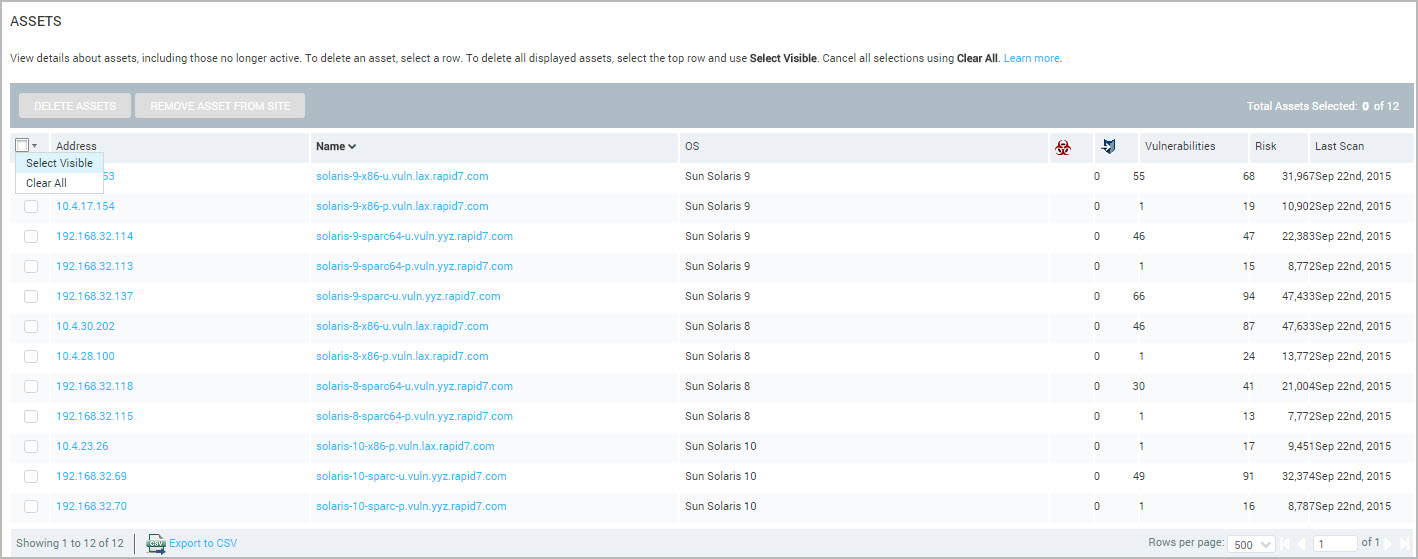
Delete all displayed assets from the Asset Details page
To delete all the displayed assets that you locate by using the site or asset group drill-down, take the following steps:
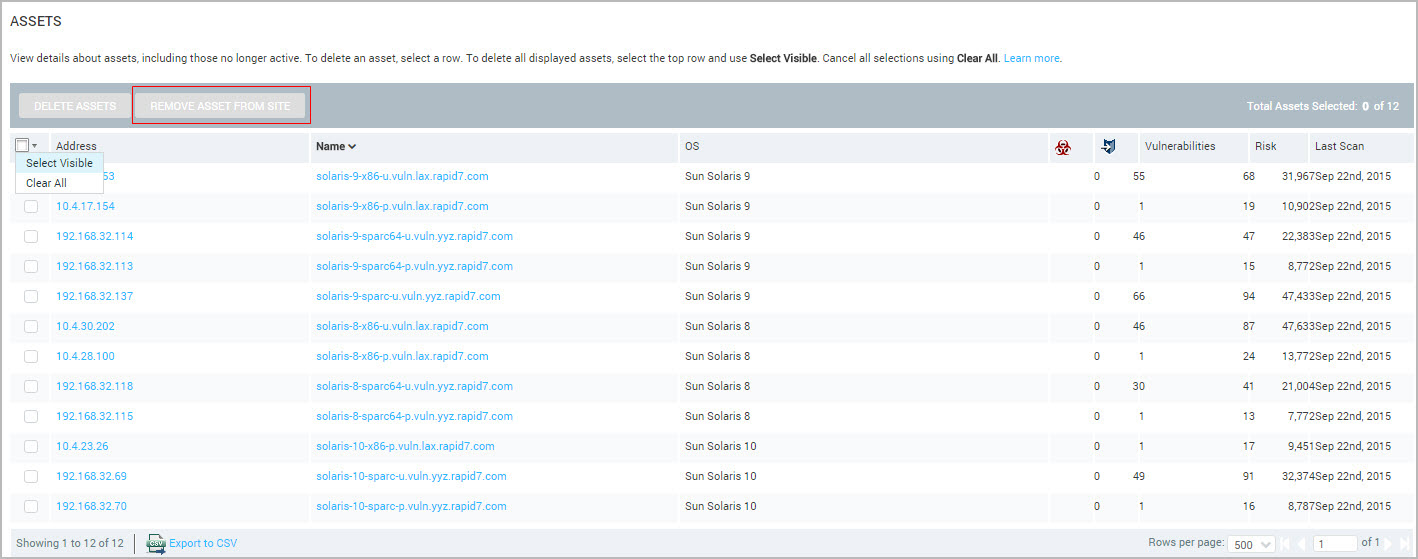
- After locating assets you want to delete, click the top row in the Assessed Assets table.
- Click Select Visible in the pop-up that appears. This step selects all of the assets currently displayed in the table.
- Click Delete Assets. To cancel your selection, click the top row in the Assessed Assets table. Then click Clear All in the pop-up that appears.
This procedure deletes only the assets displayed in the table, not all the assets in the site or asset group. For example, if a site contains 100 assets, but your table is configured to display 25, you can only select those 25 at one time. You will need to repeat this procedure or increase the number of assets that the table displays to select all assets. The Total Assets Selected field on the right side of the table indicates how many assets are contained in the site or asset group.
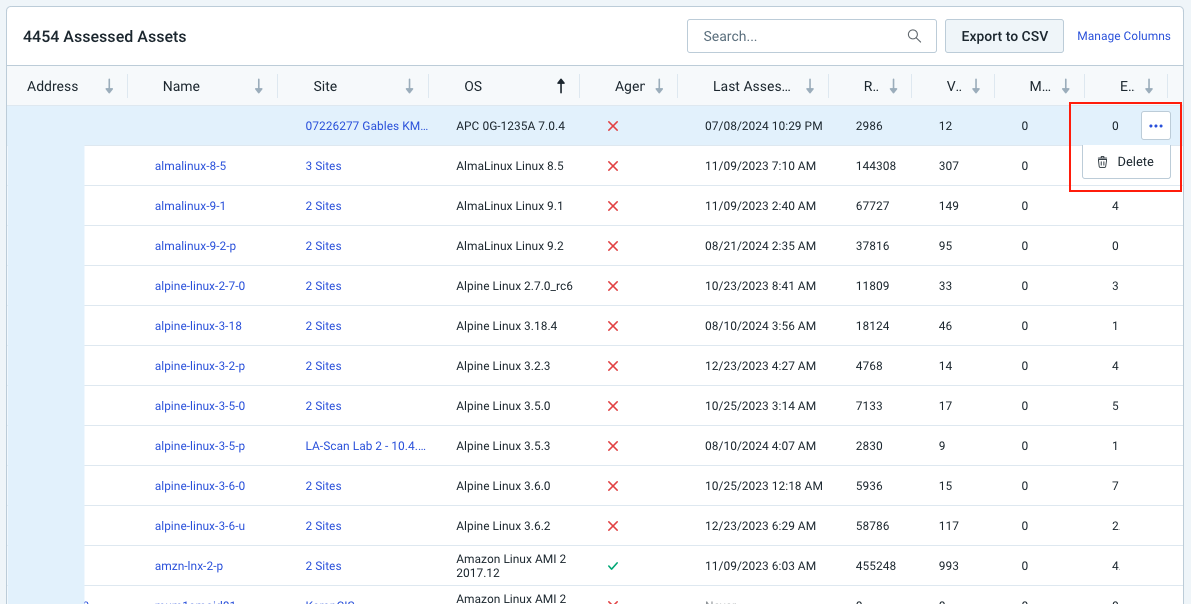
Delete assets by asset group, OS, Software, or Service
To delete assets that you locate by using the Asset, Operating System, Software, or Service listing table, take the following step:
After locating assets you want to delete, click the Delete icon for each asset.
This action deletes an asset and all of its related data (including vulnerabilities) from any site or asset group to which it belongs, as well as from any reports in which it is included.
Deletion of single assets is possible from the Assessed Assets table. For multiple asset deletion, creating asset groups and manage your assets there.
Removing vs. deleting assets at the site level
If you are globally linking matching assets across all sites (see Linking assets across sites), you also have the option to remove an asset from a site, which breaks the link between the site and the asset. Unlike a deleted asset, the removed asset is still available in other sites in which is it was already present. However, if the asset is only in one site, it will be deleted from the entire Security Console.