SIEM (InsightIDR) Advanced
As you get started, refer to this Quick Start Guide for guidance about how to approach SIEM (InsightIDR)‘s multi-step deployment process.
Not sure if you're in the right place?
If you purchased SIEM (InsightIDR) (not designated as Essential, Advanced, or Ultimate), please follow SIEM (InsightIDR) Quick Start Guide | Advanced for tasks and materials suited to your product.
We’ve outlined the important deployment milestones in this recommended order:
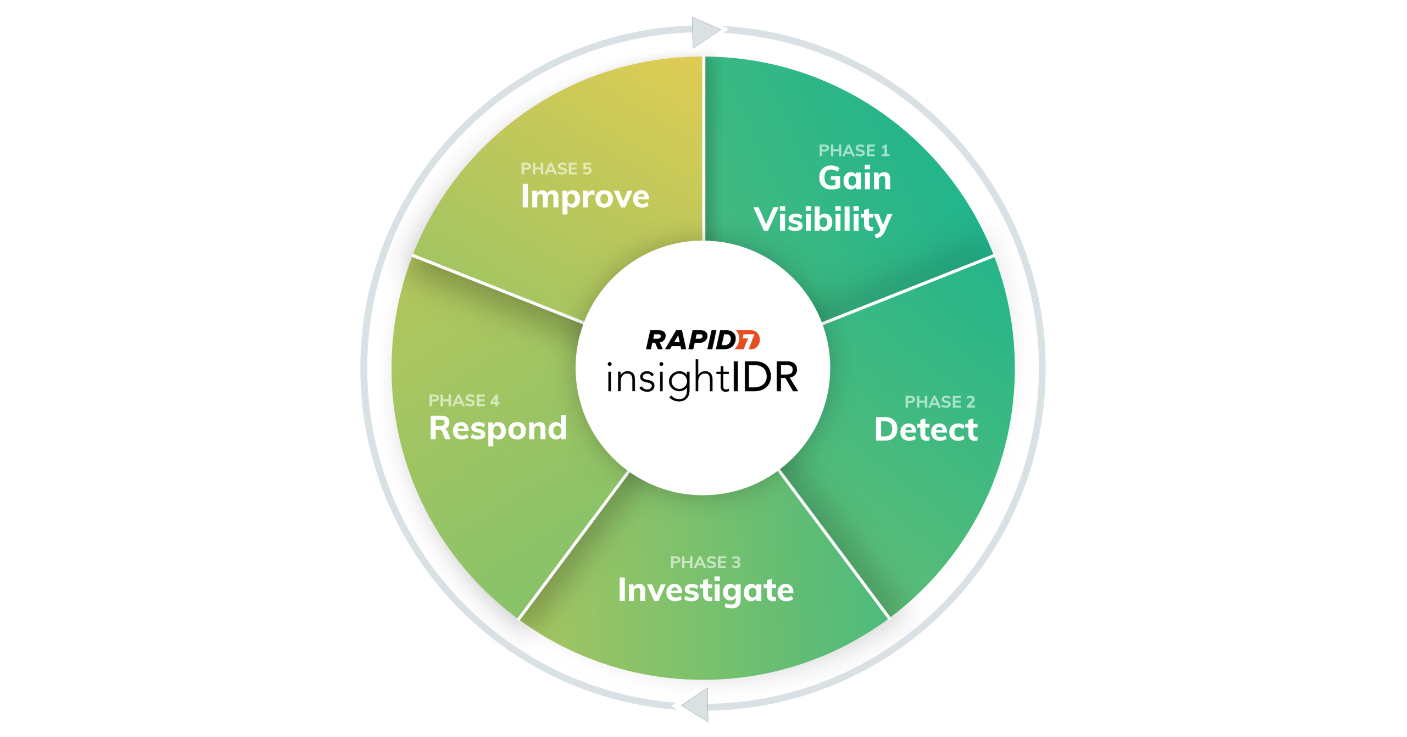
- Days 1-15: You’ll install the Collector, deploy the Rapid7 Agent (Insight Agent), and set up six core event sources to begin aggregating your environment’s data into SIEM (InsightIDR) and gain visibility across your network and digital perimeter.
- Days 16-45: You’ll review your detection coverage, explore investigations and Log Search, and begin to understand SIEM (InsightIDR)‘s deception technology so you can detect, investigate, and respond to threats efficiently and effectively.
- Days 46-90: You’ll configure basic detection rules (formerly known as custom alerts), create your first custom dashboard, and get started with automation connections and workflows to improve your detection coverage, alert fidelity, and incident response time.
Product Overview and Core Concepts
SIEM (InsightIDR) contains many features, but your first 90 days will center around the key parts of the product outlined in this section. For an overview of the areas you’ll explore, watch our SIEM (InsightIDR) Demo video!
Here’s a preview of the topics we cover in this demonstration:
- 0:00 - Overview
- 0:40 - Data Collection
- 3:23 - Log Search
- 4:29 - Dashboards and Reports
- 5:51 - Detection Rules
- 7:32 - Investigations
- 8:58 - Automation
- 10:11 - Settings
- 11:07 - Conclusion
Core Components
On-premise components
Review SIEM (InsightIDR)‘s on-premises components to understand their purpose and value.
| Component | Description |
|---|---|
| Collector | Required for: Event source log collection To retrieve data, the Collector either polls event sources for the data, or has data pushed to it from the event sources. By default, the Collector filters logs to cut down on duplicate or unnecessary data. The Collector sends the log data to the Insight Cloud for analysis. Each Collector must be installed on a dedicated host and only one Collector instance can be on each machine. |
| Rapid7 Agent (Insight Agent) | Required for: - Endpoint detection with detection rules and MITRE ATT&CK coverage - Endpoint investigative telemetry - Endpoint response actions An Rapid7 Agent (Insight Agent) is lightweight software installed on an endpoint to monitor the endpoint and report security-relevant events. To have the most cohesive understanding of your environment, it is recommended that you install an Rapid7 Agent (Insight Agent) on all endpoints and servers you wish to monitor. The Rapid7 Agent (Insight Agent) monitors specific event codes and collects endpoint telemetry data to provide an enhanced understanding of your endpoints’ activity and drive quicker response time to detections. The agent only collects data from the asset on which it is installed. |
| Rapid7 Network Sensor | Required for: - Network Traffic Analysis (NTA) - Additional asset information such as, DNS queries, asset-connected countries and IP addresses, intrusion detection signatures, and more. The Rapid7 Network Sensor allows you to monitor, capture, and assess the end-to-end network traffic moving throughout your physical and virtual environments. SIEM (InsightIDR) uses network sensor data to generate investigations and alerts based on the network traffic traversing your environment, one of which is a new investigation data source based on IPv4 flow data. SIEM (InsightIDR) also leverages DNS and DHCP information that the network sensor extracts from network packets to produce other actionable alerts. |
| Rapid7 Orchestrator | Required for: - Automation workflows The Rapid7 Orchestrator is a server in your network or cloud environment that integrates your tools and systems with Automation (InsightConnect), Rapid7’s security orchestration, automation and response (SOAR) solution. |
| Service Account | Required for: - User Behavior Analytics (UBA) powered by legacy detection rules Service Accounts represent machine accounts that are typically designed for machine processing within your network. SIEM (InsightIDR) does not expect these accounts to be used outside your network. If you mark an account as a Service Account, SIEM (InsightIDR) will monitor for any activity entering your network using that account and will generate an INGRESS FROM SERVICE ACCOUNT alert to warn you of that activity. For example, SIEM (InsightIDR) would generate an alert if someone used a Service Account to log in to a VPN. |
| Event Source | Required for: - Specific detection rules and legacy detection rules An event source is an application, appliance, server, service, or other IT asset that generates log events. |
Detection rules, alerts, and deception technology
Review this section to understand SIEM (InsightIDR)‘s essential detection features, their purposes, values, and how they contribute to your environment’s security.
| Component | Description |
|---|---|
| Detection Rules | Detection rules are the logic SIEM (InsightIDR) uses to detect threats using Rapid7’s wide array of threat intelligence. Our Detection Rule Library covers a variety of user behaviors and attacker techniques. What it powers: - MITRE ATT&CK matrix - Alerts |
| Legacy Detection Rules | Legacy detection rules run on SIEM (InsightIDR)‘s legacy User Behavior Analytics (UBA) engine. These rules apply insight to the millions of network events your users generate every day to detect compromised credentials, lateral movement, and other malicious behavior. What it powers: - Alerts generated by legacy detection rules - Investigations generated by legacy detection rules |
| Basic Detection Rules | Basic Detection Rules are available to you for the times when SIEM (InsightIDR)‘s built-in detection rules do not suit your needs or when you want to track certain behaviors that are specific to your environment. If you need to detect on certain, custom events, create a basic detection rule. There are three types of basic detection rules: Inactivity Detection, Pattern Detection, and Change Detection rules. What it powers: - Basic detection rule investigations - File Integrity Monitoring (FIM) investigations |
| Deception Technology | Deception technology allows you to create an illusion for attackers that they have found something of interest in your environment. When you deploy intruder traps on your network, they act as a virtual trip wire. Once an attacker is tricked into accessing the trap, SIEM (InsightIDR) fires an alert to flag the suspicious activity. What it powers: - Legacy detection rules - Investigations generated by legacy detection rules |
| Honeypot | A honeypot is a virtual server that you can deploy on your network. Honeypots can look like any other machine on the network, or they can be deployed to look like something an attacker could target. You can have a single honeypot or multiple honeypots, and you can deploy them straight out of SIEM (InsightIDR). Honeypots lie in wait for “attacker” events to happen, such as a port scan or an attempted user authentication, which immediately sets off an alarm. If you deploy the Rapid7 Honeypot and enable the associated alerts in SIEM (InsightIDR), you will be notified if such an activity occurs. Once attackers find an initial foothold in a network, their next step is typically to run a network scan to identify all the other assets in the network. Includes Honey Users, Honey Files, Honey Credentials, and Honey Alerts What it powers: - Honeypot Access detection rule and investigations - Honey User Authentication detection rule and investigations - Honey File Accessed detection rule and investigations - Local Honey Credential Privilege Escalation Attempt detection rule and investigations - Remote Honey Credential Authentication Attempt detection rule and investigations - Corresponding Honey Alert type investigations |
| File Integrity Monitoring (FIM) | File Integrity Monitoring (FIM) allows you to audit and monitor changes to critical files and folders on your network. When you turn on FIM, the Rapid7 Agent (Insight Agent) starts collecting FIM events. SIEM (InsightIDR) can then attribute users to file modification activity. You can create alerts based on certain file log events to notify you when one of your users modifies a critical file or folder. What it powers: - FIM alerts - FIM investigations |
SIEM (InsightIDR) Architecture
Watch this SIEM (InsightIDR) architecture and system components overview on the Rapid7 Academy.
Prepare for Deployment
To ensure you get the most out of your first 90 days with SIEM (InsightIDR), it’s important to understand your deployment tasks and create a plan for deployment.
Supported Browsers
Rapid7 supports SIEM (InsightIDR) in Google Chrome (latest stable release) and Mozilla Firefox (latest stable release).
Set up a service account
Before provisioning resources and deploying SIEM (InsightIDR), you must set up a Service Account to collect log data for SIEM (InsightIDR). You can either designate an existing user account, or create a Service Account.
Review the Service Account requirements and set up an account.
Review system requirements
Each component of SIEM (InsightIDR) requires specific resources. Navigate to each component’s designated page for a full list of requirements.
| Component | Required Resources |
|---|---|
| Collector | - 4 CPU cores with 2GHz+ on each core - 8 GB RAM recommended - 60 GB+ available disk space - Configured with a Fully Qualified Domain Name (FQDN) such as idrcollector23.myorg.comSee Collector Requirements requirements for more information. |
| Rapid7 Agent (Insight Agent) | Required ports for Collector communication through TCP: - 5508 - 6608 - 8037 See Rapid7 Agent (Insight Agent) Requirements requirements for more information. |
| Service Account | You can either designate an existing user account as a service account, or create a new account account as your service account, that meets all of the following requirements: - Active Directory Permissions - LDAP Permissions - Microsoft DNS Permissions - Microsoft DHCP Account Permissions See Setting Up a Service Account for more information. |
| Event Source | Designate a Service Account with the correct permissions See Core Event Sources for more individual event source requirements. |
| Honeypot | - 1 CPU - 1GB RAM - 10 GB hard disk space See Honeypot Requirements for more information. |
| Rapid7 Network Sensor (Insight Network Sensor) | Although the network sensor software itself runs in the form of a container, all physical or virtual network sensor hosts must run one of the following supported Linux operating systems. The version number shown for each one indicates the minimum supported version: - Ubuntu Server 20.04 and later - RHEL 7.2 and later - CentOS 8 and later - Fedora 30 and later - SUSE 15.0 and later - Debian 8.11 and later See Network Sensor Host Requirements for more information. |
Provision resources in your environment
We recommend provisioning specific resources as soon as possible to ensure a quick and easy deployment experience.
These core components require provisioning hardware:
- 1 server to install the SIEM (InsightIDR) Collector
- 1 server to install the Rapid7 Orchestrator (Insight Orchestrator)
- A virtual or physical Linux host to install Rapid7 Network Sensor (Insight Network Sensor) software
- A source of network traffic for the Rapid7 Network Sensor (Insight Network Sensor)
Log in to the Command Platform (Insight Platform)
Already have an Command Platform (Insight Platform) account?
If you already have a platform account from a trial or existing subscription to another Rapid7 solution, you’re all set! Use your existing email address to log in to https://insight.rapid7.com/login .
The Rapid7 Command Platform (Insight Platform) is your base within the ecosystem of Rapid7 cloud products and services. It provides a centralized location for administrative functions and makes navigating the Insight product suite simple and easy.
To log in to the platform, you need a Rapid7 Command Platform (Insight Platform) account. You also must allowlist the platform login domain, using the *insight.rapid7.com wildcard.
To create an account:
- Check your corporate email inbox for an email from the Rapid7 Command Platform (Insight Platform) team.
- Visit
insight.rapid7.com/login. - Select Haven’t activated your account?.
- Enter your corporate email address to receive an activation email with next steps. If you do not receive an activation email, reach out to your Customer Adoption Manager (CAM) or Customer Success Advisor (CSA).
- Refer to the activation email and follow the instructions to create and activate your Command Platform (Insight Platform) account
Configure daily data archiving
SIEM (InsightIDR) stores your log data for a retention period of 13 months. If you need to retain data for longer than that period, such as for security investigation or compliance purposes, we recommend that you set up daily archiving. Archiving allows you to retain a copy of your log data using the storage capabilities of Amazon S3.
To set up data archiving, see Data Archiving.
Daily Archiving versus Historical Data Archiving
If you do not configure daily archiving, you can download a backup of your data up to 2 times a year using SIEM (InsightIDR)‘s Historical Data Archiving feature. This process can take several days to complete.
Additional Resources
- Plan your SIEM (InsightIDR) deployment with the help of the Rapid7 Academy.
- Conduct a Network and Environment Audit
Days 1 - 15: Get Up and Running
Install Collectors, deploy Rapid7 Agents (Insight Agents), and set up core event sources so SIEM (InsightIDR) can begin collecting the right data to detect, investigate and respond to threats in your environment.
Install the Collector
The Collector is the on-premises component of SIEM (InsightIDR) that either polls data or receives data from Event Sources and makes it available for SIEM (InsightIDR) to analyze. (An Event Source represents a single device that sends data in the form of logs to the Collector.)
The Collector captures the data generated by your event sources, compresses the data, encrypts it, and pushes it up to the Command Platform (Insight Platform). The Command Platform (Insight Platform) will then normalize, attribute, analyze, and present that data for search.
How to install
Identify all the servers where event source data originates from. Many networks consolidate security and network administration tools and services in a data center or corporate office. This central location is an ideal place to deploy a Collector on a dedicated host.
- Review the Collector Requirements.
- Install collectors on network servers or virtual machines that meet the following requirements:
- 4 CPU cores with 2GHz+ on each core
- 8 GB RAM recommended
- 60 GB+ available disk space
- Configured with a Fully Qualified Domain Name (FQDN) such as idrcollector23.myorg.com
For detailed setup instructions, see Collector Installation and Deployment.
Deploy the Rapid7 Agent (Insight Agent)
The Rapid7 Agent (Insight Agent) enables SIEM (InsightIDR) to provide continuous endpoint detection and response, which is necessary for identifying the early signs of an attack.
The Rapid7 Agent (Insight Agent) collects live system information – including basic asset identification information, running processes, and logs – from your assets and sends it to the Command Platform (Insight Platform) for analysis. The data is then passed to SIEM (InsightIDR), where it unlocks the vast library of attacker behavior and endpoint detection rules. Combined with network and user data, this helps you identify stealthy attacks for both your critical and remote assets across the MITRE ATT&CK framework.
How to deploy the Rapid7 Agent (Insight Agent)
Each Rapid7 Agent (Insight Agent) only collects data from the endpoint on which it is installed. You must install the Agent on all assets you want SIEM (InsightIDR) to monitor. The Rapid7 Agent (Insight Agent) can be installed directly on Windows, Linux, or Mac assets.
You can deploy the Rapid7 Agent (Insight Agent) on your target assets using either a token-based installer or certificate package installer. The token-based installer uses a token to download configuration files, whereas the certificate package installer provides a .zip file with the configuration files.
- Decide which installer is best suited for your environment.
- Read the steps to download the installer and follow the instructions.
Set up core event sources
SIEM (InsightIDR)’s core event sources provide the most data in regards to user attribution. User attribution correlates endpoint activity to individual users, including what endpoint applications they use, and when. Attribution gives you a more complete image of your security posture, as user accounts are the most common targets for sophisticated attacks.
Use with production environments only
Only connect production environments with event sources. Rapid7 does not process payloads that look like they are originating from test environments. If you connect a test environment, its data may not be ingested.
Setup instructions for each event source can vary depending upon the technologies you use.
To take advantage of SIEM (InsightIDR)‘s detection rule capabilities, you must set up these event sources:
LDAP
Required for: Detection Rules and Legacy Detection Rules
Adding a Lightweight Directory Access Protocol (LDAP) server allows SIEM (InsightIDR) to track the users, admins, and security groups contained in the domain and to link account activity with real users to identify privileged and service accounts.
To add the LDAP event source
- Designate a Service Account with the correct permissions.
- Open Port 636 (LDAPS) between the Collector and the LDAP server.
For detailed setup instructions, see LDAP.
Active Directory
Required for: Detection Rules and Legacy Detection Rules
Active Directory provides security logs from your domain controllers and authentication and administrative events for your domain users. Make sure that you add one Active Directory event source for each domain controller.
To add the Active Directory event source
- Open ports 135, 139, and 445 between the Collector and Active Directory.
- Designate a Service Account with the correct permissions.
For detailed setup instructions, see Active Directory.
DHCP
Required for: Legacy Detection Rules
Dynamic Host Configuration Protocol (DHCP) event logs provide IP lease information to correlate each IP address with its assigned host at the time of the event.
To add the DHCP event source
Choose one of the following methods:
- Domain Admin Account: Use this method if you want to collect logs using a Domain Admin account.
- NXLog: Use this method if you don’t want to use a Domain Admin account to collect logs.
DNS
Required for: Legacy Detection Rules
Connecting DNS as an event source allows SIEM (InsightIDR) to track services, incidents, and threats found on your network. DNS logs gathered from a DNS event source provide more information about web traffic. DNS also provides greater visibility into destination URLs, which can be flagged in Account Visited Suspicious Link incidents.
For instructions on how to configure DNS appliances with SIEM (InsightIDR), see DNS.
VPN
Required for: Detection Rules and Legacy Detection Rules
VPN logs provide visibility into users’ remote network ingress activity and allow you to collect and verify information about user activity.
For setup instructions, see VPN.
Firewall
Required for: Detection Rules
By introducing Firewall data, you allow SIEM (InsightIDR) to track visits to malicious domains or cloud services. More than simply collecting configuration logs and change logs, SIEM (InsightIDR) can automatically attribute connection events to the users and endpoints that are accessing such websites.
We recommend you set up separate Firewall event sources for each Firewall type.
To add a Firewall event source
Determine which Firewall event source(s) best suits your needs and follow the related configuration steps.
For setup instructions for each type of Firewall event source, see Firewall.
Days 16 - 45: Alert and Investigate
Dive into SIEM (InsightIDR)’s detection coverage! Explore detection rules, investigations, alerts, deception technology, and Log Search to see how all of these components work together. Start using SIEM (InsightIDR)‘s powerful query capabilities, and visualize your log data using dashboards.
Review your detection coverage
SIEM (InsightIDR) Detection Engines
SIEM (InsightIDR)‘s detection capability is powered by 3 detection engines – The detection rule engine, the legacy UBA engine, and the basic detection rule engine (formerly known as custom alerts). Let’s take a look at each:
- Detection rule engine: The primary detection rule engine detects on a variety of user behaviors and attacker techniques. Each detection rule hunts for a unique attacker behavior or user behavior.
- Legacy UBA engine: The legacy UBA engine is powered by built-in legacy detection rules that apply insight to the millions of network events your users generate every day. These rules detect compromised credentials, lateral movement, and other malicious behavior.
- Basic detection rules: SIEM (InsightIDR) provides powerful detection capabilities, but there may be times when they do not cover all your requirements. The basic detection rules engine allows you to create custom alerting rules to detect inactivity, patterns in data, or changes in data.
Detection Rules
Detection rules are the logic SIEM (InsightIDR) uses to detect threats using Rapid7’s wide array of threat intelligence. When the logic of a detection rule matches an event, an alert is created. Certain alerts automatically trigger investigations – this behavior is defined in the detection rule logic. On the Detection Rules page, you will find 2 tabs of built-in detection rules:
- Detection Rule Library: The Detection Rule Library contains rules that detect on a variety of user behaviors and attacker techniques. You can see all detection rules and the number of detections over the last 30 days on the Detection Rule Library tab of the Detection Rules page. You can also view rule logic, related Threat Groups and MITRE ATT&CK mapping, and filter, sort and search detection rules.
- Legacy Detection Rules: Legacy Detection Rules run on SIEM (InsightIDR)‘s legacy User Behavior Analytics (UBA) engine. These rules apply insight to the millions of network events your users generate every day to detect compromised credentials, lateral movement, and other malicious behavior. To view legacy detection rules in SIEM (InsightIDR), click Detection Rules in the left menu, and click the Legacy Detection Rules tab.
All out-of-the-box detection rules can be tuned to suit your environment’s needs:
Notable Events and Alerts that allow you to prioritize your response
Every moment SIEM (InsightIDR) is running, it finds and collects thousands of threats from all the assets and endpoints it has visibility into. However, many activities set off alerts even though they are not high profile threats, causing unnecessary alarm and risking potential burnout for Security teams investigating these alerts.
Notable Events
As a part of SIEM (InsightIDR)‘s legacy user behavior analytics (UBA), SIEM monitors and baselines each user’s activity, establishing a pattern for which assets the user owns, which assets they access, their remote login location, and other activity. Notable Events are the events that fall between expected behavior and alert-worthy behavior. It is expected that almost any network will experience a large number of notable events on any given day.
When user activity triggers an alert that generates an investigation, related notable events are automatically added to Investigation Timeline. This helps analysts better contextualize the behavior without these notable events going completely unobserved, and ensures your security team isn’t overwhelmed with low fidelity alerts.
Alerts
Alerts arrive to you in the form of an email with an incident number and short description to inform you of notable events and suspicious behavior captured by SIEM (InsightIDR). There are a few different types of alerts and alert settings available:
- Legacy detection rules: SIEM (InsightIDR) has over 60 legacy detection rules that are generated by SIEM (InsightIDR)‘s legacy User Behavior Analytics detection engine.
- Basic detection rules: For detailed information on SIEM (InsightIDR)‘s basic detection rule capabilities, check out the configuration sections for Log Inactivity Detection Rules, Log Pattern Detection Rules, and Log Change Detection Rules.
Explore investigations
Investigations are an aggregate of the applicable alert data in a single place and are closely tied to Detection Rules and Alerts. The Investigations page allows you to quickly search your active investigations and provides you with the context you need to effectively prioritize, sort, and respond to alerts.
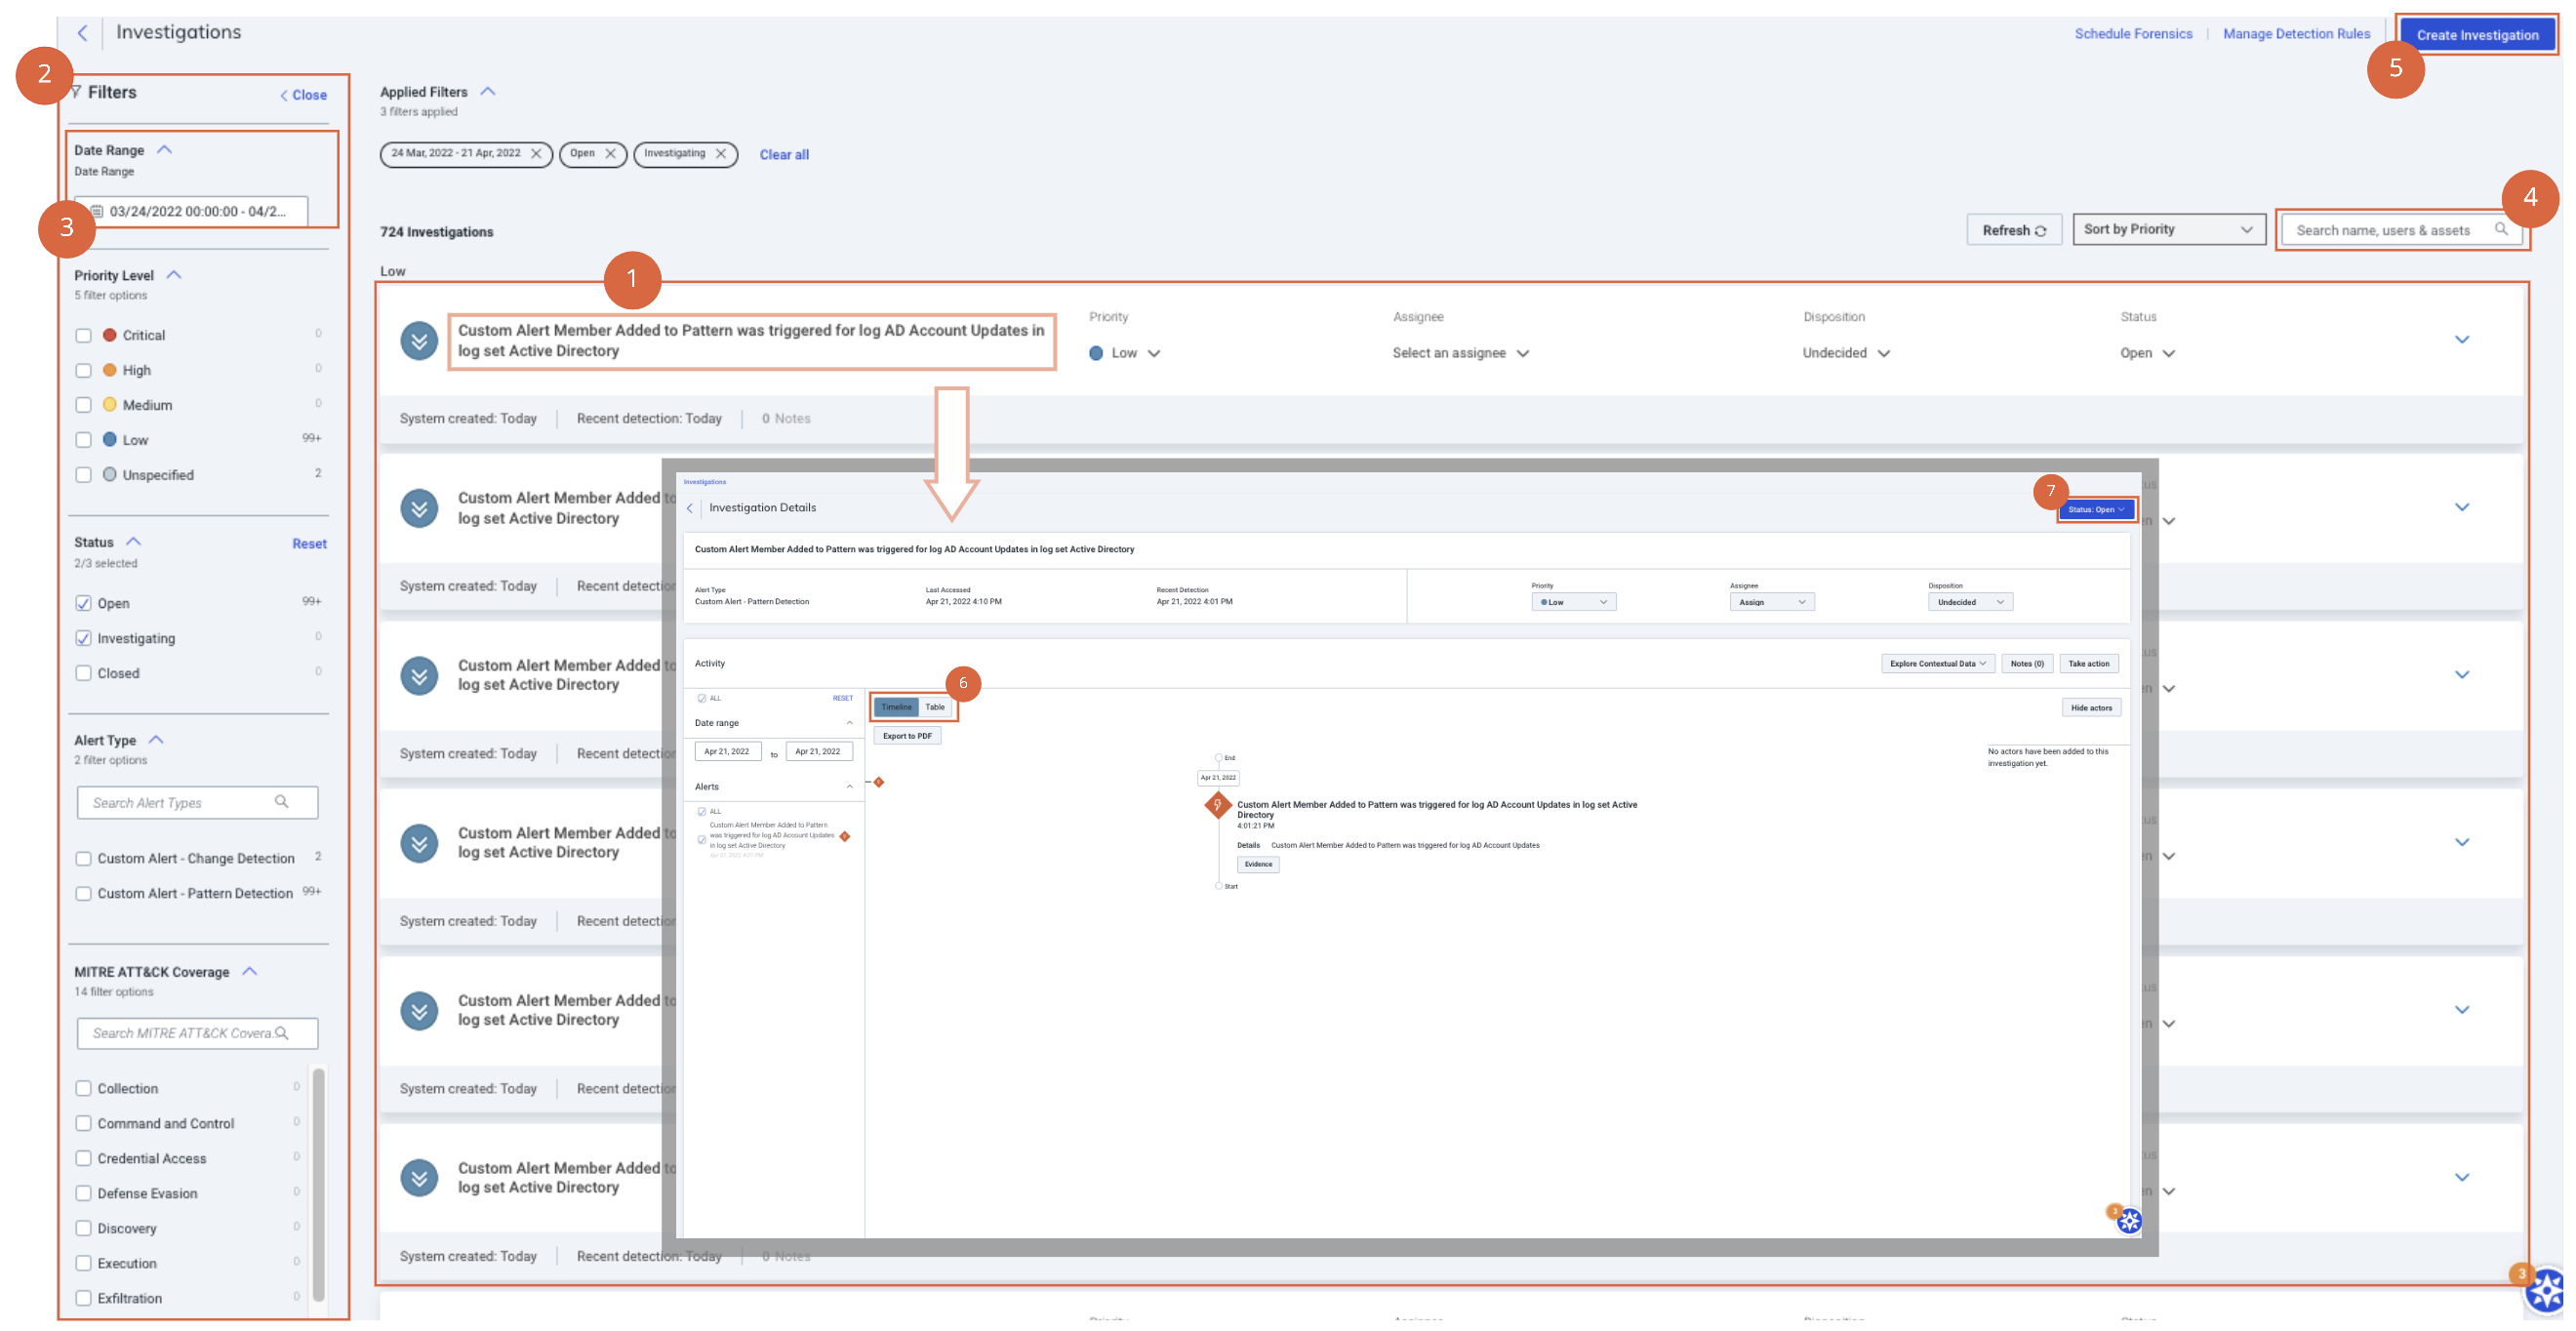
Let’s review the Investigations home screen:
- Investigations are listed in order of priority — low, medium, high, and critical. You can also sort them by date created and by most recent detection.
- Filter your investigations by their attributes.
- Select the date range of the investigations you want to explore.
- Search your investigations by investigation name, associated users, or associated assets.
- Create a new investigation.
- Toggle between timeline and table view for a detailed look into a specific investigation.
- Change the status of an investigation to open, investigating, or closed.
See Investigations to learn more.
Explore Log Search and Queries
Your connected event sources and environment systems produce data in the form of raw logs. Log Search takes every log of raw, collected data and automatically sorts them into log sets for you. New log events are added to the existing log and grouped with other logs in the log set, based on when the log event was created.
When data is ingested, repetitive activity is processed and combined into a single entry. The count of the repeated events are included in the combined entry, and other fields such as bytes transferred are summarized. To learn more about data deduplication, read Collector Overview.
Use queries to enrich alerts and investigations
You can search your logs to learn more about the incident in your environment that triggered the alert or the investigation.
Log Entry Query Language (LEQL) is used when building queries in SIEM (InsightIDR). LEQL supports Regular Expressions (RegEx) and can be used when creating basic detection rule queries and dashboards.
Log Search supports many SIEM (InsightIDR) capabilities:
- Data ingestion
- Detection
- Basic detection rules
- Dashboards and reporting
- Compliance standards
Build and save a query
SIEM (InsightIDR) provides different ways to search your data, including RegEx, String, KeyValue, or Keyword searches. With LEQL, you can construct queries to extract the hidden data within your logs.
LEQL follows SQL-style syntax and constructing a query is simple and intuitive. SIEM (InsightIDR) requires you to input a where() clause first (if your query requires one) and add subsequent clause(s) and function(s), such as groupby() or calculate, respectively.
where ()= searchgroupby ()= fieldcalculate (:)= function:field
Try it out
Test these queries in Log Search and see the results for yourself.
- where(result ISTARTS-WITH “failed” AND logon_type!=NETWORK)groupby(destination_user, destination_asset)limit(5, 1)
- where(action=MEMBER_ADDED_TO_SECURITY_GROUP AND group IIN [admin, desktop, network, support, “service accounts”])groupby(source_user, target_account, group)
- where(source_account==target_account)groupby(action, source_user))
To save a query for future use, click the ellipsis next to the Run button and select Save Query.
See Log Search for more information.
Visualize your data with dashboards
Dashboards allow you to build custom views of the data you want to monitor. As a starting point, either create a new dashboard or use an existing dashboard. Add, edit, resize, and rearrange the data visualization widgets to tailor the data view to your needs.
Explore the IT Operations Dashboard
The IT Operations Dashboard offers a high level view of Weekly Account Lockouts and Unlocks, Most Active admin accounts on user accounts. Most Active admin accounts on their own accounts, Top 5 Directory groups by most membership adds, and more.
The IT Operations Dashboard is populated by data sent from Active Directory, Firewall, VPN, and Cloud Service event sources. To take advantage of this dashboard, be sure those event sources have been set up.
- Active Directory event sources send Active Directory Admin Activity, Asset Authentication and Raw log data.
- Firewall and VPN event sources send Firewall Activity and Ingress Authentication logs.
- Cloud Service event source send Ingress Authentication logs.
To set up the IT Operations Dashboard
- From the SIEM (InsightIDR) left menu, click Dashboards and Reports.
- From the dashboard list, click the Dashboard Library button. The Dashboard Library modal appears.
- Search for the IT Operations Dashboard and click Add.
Understand deception technology
Some types of stealthy behavior can be difficult to discern from normal activity, allowing the attacker to sneak past your security tools and into your organization undetected. Placing intruder traps as a way to distract attackers can often help you find attackers earlier and take action to block them before they access something they should not.
Review Honey Items
Rapid7 Honey Items, a type of intruder trap, can attract hackers because they are “sweet” with opportunity. The most common type of intruder trap is a honeypot, which is a decoy system designed to gather information about attackers on your network. It can help you learn how attackers are accessing your systems.
SIEM (InsightIDR) has four kinds of deception traps that you can configure and deploy. Attempted access or use of these intruder traps triggers Honey Alerts in SIEM (InsightIDR). We recommend deploying deception traps in this recommended order:
- Honeypots: Deploy these to cover as much network as possible (for instance, one for each subnet).
- Honey Users: Add a user to the Active Directory that matches how you typically configure usernames, but also conveys it may be a domain admin.
- Honey Files: Deploy files that appear to be valuable, such as a financial report or something with personally identifiable information (PII).
- Honey Credentials: These are managed by Rapid7 on the Agent so no setup is required.
Configure a honeypot
A honeypot is a virtual server that you can deploy on your network from SIEM (InsightIDR). Honeypots can look like any other machine on the network, or they can be deployed to look like something an attacker could target. You can have a single honeypot or multiple honeypots, and you can deploy them straight out of SIEM (InsightIDR). Honeypots lie in wait for “attacker” events to happen, such as a port scan or attempted user authentication, which immediately sets off an alarm. If you deploy the Rapid7 Honeypot and enable the associated detection rules in SIEM (InsightIDR), you will be notified if such activity occurs. Once attackers find an initial foothold in a network, their next step is typically a network scan to identify all the other assets in the network.
SIEM (InsightIDR)‘s Honeypot is an OVA appliance designed for deployment in VMware environments. The honeypot can detect network reconnaissance, typically in the form of suspicious network or port scanning. The Honeypot OVA contains an appliance that is able to listen on all ports. All scanning or connection attempts are allowed. Each time a connection is attempted, the honeypot captures information about the source asset, and potential user associated with the connection. This data is immediately pushed up to the Insight platform, generating a Honeypot Access Alert.
How to configure a honeypot
- From the SIEM (InsightIDR) homepage, click Data Collection on the left menu.
- In the top right corner, click Setup Honeypot and select Download Honeypot.
The Honeypot OVA download will begin automatically. See Download a Honeypot for next steps.
Additional Resources
- Map SIEM (InsightIDR) Detections to the MITRE ATT&CK Framework Rapid7 Academy lesson
Days 46 - 90: Optimize for Success
Configure basic detection rules (formerly known as custom alerts), create custom dashboards, and create automation workflows to tailor SIEM (InsightIDR) to your environment’s unique needs.
Configure Basic Detection Rules
With SIEM (InsightIDR), you have the option of creating basic detection rules when built-in rules do not suit your needs. You configure basic detection rules in Log Search. Basic detection rules can be created manually, or configured to auto-populate. You can always switch to a different rule type during configuration. There are three kinds of basic detection rules.
Log Inactivity Detection Rules
Also known as “Up Down Monitoring”, inactivity rules can be used to notify you when an entire log, log group, or particular pattern becomes inactive for a given time period.
For setup instructions, see Auto-populate a Log Inactivity Detection Rule or Manually configure a Log Inactivity Detection Rule.
Log Pattern Detection Rules
In order for a detection to trigger, a log must match the exact pattern you enter as a search term. Detecting on patterns can be useful in situations such as monitoring server errors, critical exceptions, and general performance, and allows you to only monitor events that are important to you.
For setup instructions, see Auto-populate a Log Pattern Detection Rule or Manually create a Log Pattern Detection Rule.
Log Change Detection Rules
Log change detection rules will notify you when a condition changes, such as HTTP 500 errors in your web access logs. They are based on calculations that you apply to logs or log sets.
For setup instructions, see Auto-populate a log Change Detection Rule or Manually configure a Log Change Detection Rule.
Customize your dashboards
SIEM (InsightIDR)‘s dashboards are customizable to ensure your views of your environment meet your needs. While it’s easier to customize a dashboard template, you can also create a new one from scratch. Although dashboard customization is up to you, we’d like to share some key elements to explore while building your dashboards.
Edit the widgets
After adding a widget to your dashboard, click the gear icon in the top right corner of a widget and select Edit.
- Name Widget : Change the widget’s name and description to provide more clarity from the dashboard view.
- Select Data Source :
- Use a previously saved query and customize the Full Query to show the data you want to highlight.
- Change the time range for the data shown in the widget.
- Change the log set the widget’s data is referencing.
- Configure Chart : Add a caption, add data labels, change the scale, and change the colors of your widget
- Captions are a free text form to provide additional context of the widget’s data from the dashboard view.
- Colors are best for differentiating between multiple groups in one widget. Try editing the colors of a Stacked Bar chart!
- Switch Charts : You can choose the best way to visualize your widget’s data from the charts listed in the Switch Charts section. SIEM (InsightIDR) will only make the charts available that can correctly display your data.
Apply a LEQL query to an entire dashboard
By clicking the filter icon in the top menu of your dashboard, you can add a query to filter all of your dashboard’s data. Check out our documentation for help building a query.
Choosing the right chart for your data
To determine the best chart to display your data, here are some example use cases for each format.
- For examining trends or activity over time, use an Area, Line, Stacked Area, or Stacked Bar chart.
- For comparisons across different categories, use a Bar or Bar Horizontal chart.
- For understanding top trends and groups, use a Packed Bubble, Word Cloud, or Pie chart.
- For a quick glance at a single data point, use a Number chart.
- For visualizing cyclical data in relation to time, use a Radial chart.
- For an easy-to-scan view of individual data points across categories, use a Table chart.
Size your dashboard widgets
Changing the size of your widgets on your dashboard helps highlight certain data views you will use often, or grabs other users’ attention when viewing your dashboard for the first time.
To adjust a widget’s size, click and drag the bottom-right corner.
How to create and save a new custom dashboard
- From the left menu, click Dashboards and Reports.
- From the dashboard list, click the New Dashboard button. The New Dashboard modal appears.
- Enter a Dashboard Name and Description. The Description is optional, but it helps differentiate all of the dashboards at your organization.
- Click the Create Dashboard button.
Now that you’ve saved your new dashboard, it’s available in the dashboard list. To add data visualization widgets to your dashboard, you’ve been directed to the Widget Library. You can find, add, and customize widget for your dashboard. If you can’t find a widget you want in the Widget Library, build your own in the Widget Builder.
See Dashboard Widgets to learn how to customize your widgets.
Get started with automation
Automation can greatly improve the efficiency of your team by tackling security issues as they emerge in your environment. Automatically containing threats, quickly notifying your team of suspicious activity, and tracking the progress of an investigation are just three of the ways that automation can help to streamline your security processes.
To take advantage of automation, you must install the Rapid7 Orchestrator (Insight Orchestrator) and configure automation connections. Once the Orchestrator is set up, you can explore our out-of-the-box workflow templates and use automation to enrich your investigations.
Automation core concepts
Review these automation core concepts to understand how to successfully apply automation across your detection, investigation, and response tasks.
- Orchestrator: The Rapid7 Orchestrator (Insight Orchestrator) is an on-premise technological component that aids connection between your environment and the cloud.
- Connections: Connections enable two-way communication between SIEM (InsightIDR) and third-party products, solutions, and tools. They are comprised of 2 parts: Plugins are the third-party integration sources with defined automation triggers and actions, while credentials are the sensitive secrets that enable authentication into a third-party source.
- Workflows: Workflows are automated processes designed to quickly work through key tasks across detection, investigation, and response. They can be completely automated, or have human decision steps along the way so a member of your team can provide necessary context when it’s needed most. Workflows can also be simple one-off actions, or a complex tree of orchestrated steps.
- Triggers: Instead of requiring manual action, Triggers will automatically initiate a workflow in response to a security event. Triggers are currently available for legacy detection rules only.
How to set up automation
Step 1: Install and Activate the Rapid7 Orchestrator (Insight Orchestrator)
The Rapid7 Orchestrator (Insight Orchestrator) is a component installed on your network that gives SIEM (InsightIDR) the access it needs to automate security processes. You must have an orchestrator if you want to take advantage of the Automation features available in SIEM (InsightIDR).
- From the SIEM (InsightIDR) left menu, click Data Collection.
- Click the Orchestrators tab, click Install Orchestrator, and follow the on-screen prompts. Automation (InsightConnect) uses plugins to give you access to a wide variety of capabilities, from data manipulation to response actions. The Rapid7 Orchestrator (Insight Orchestrator) uses Docker containers to run individual plugins.
Docker container management
The Orchestrator uses Docker containers to run individual plugins. While you may log into the Orchestrator to view and manage these Docker containers, it is not necessary and is not advisable unless you have been directed to do so by the Rapid7 support team.
Step 2: Configure automation connections
Task 1: Find Connection Requirements
SIEM (InsightIDR) currently supports automation for the following third-party integrations:
- Active Directory
- Cb Response
- JIRA
- Okta
- ServiceNow
To review their connection requirements, see Configure Connections for Automation.
You can also view Connection requirements from the Extension Library or Automation (InsightConnect)
- In the Extension Library , search to find the plugin you want to connect, and click the Documentation tab. The Setup section shows the parameters required to configure a plugin connection.
* In Automation (InsightConnect), navigate to Settings > Plugins & Tools, select the desired plugin, and click the Help tab. The Setup section shows the parameters required to configure a plugin connection.
Task 2: Create a Connection
After you gather information for your connections, you can configure the connections for your workflows. For instructions, see Configure Connections.
You can also create Connections requirements in Automation (InsightConnect)
- From Automation (InsightConnect)‘s home page, navigate to Settings > Plugins & Tools > Connections, click Add Connection, and select the desired plugin from the Plugins list.
* From the workflow builder, add an action step, select the desired plugin, select an action, and click Add a New Connection in the Choose a Connection step.
Task 3: Create a Credential
Most connections require a credential for use. Credential types include API keys, username/password pairs, and other sensitive information that is encrypted at rest and in transit. Credentials are saved separately from connections so that they may be reused across multiple connections as needed. Credentials used in your connections are encrypted on the Orchestrator itself. For more information about credential security, see Orchestrator Security.
- Click on the Choose a Credential input in the connection configuration menu and select Create New Credential.
- Enter a display name for your credential, then enter the credential itself.
- Click Save and proceed with your connection configuration.
For more information on editing credentials and using existing connections, see Automation (InsightConnect) Create a Connection.
Step 3: Create a workflow from a template
Workflows are available for you to kick off when there is something in your investigation that requires you to take action. You can use out-of-the-box workflow templates to set up Workflows that do things like quarantine an asset, suspend a user account from within an investigation, and create JIRA tickets. These Workflows are based on Workflow Templates. These templates are workflows that do not have configured connections and are handy when you need to reuse Workflow steps with different connections.
Create your first workflow
After you’ve installed an Orchestrator, we recommend starting with the Open Source Alert Enrichment workflow to contextualize your investigations and alerts.
- Open the Investigation where you’d like to add automation and click Take Action.
- Click Enrichment Workflows from the Select an Action category.
- Click Enrich Alert Data with Open Source Plugins from the Select and Automation Action to Take dropdown.
- Follow the instructions to name your workflow, select connections, and configure details.
- Click Take Action to launch your workflow.
To configure other workflow templates, see Automation Workflow Templates.
Step 4: Use a workflow in an investigation
To begin using automation workflows to streamline your investigations, try an Automated Enrichment Workflow. SIEM (InsightIDR) offers built-in enrichment workflow templates that you can configure.
These workflows can process and enrich the following input data types:
- Asset
- Domain
- IP Address
- Process
- URL
- User
Most enrichment workflow templates are capable of processing four or more of these data types from the same investigation, but SIEM (InsightIDR) does not require all data types to be present in order for the workflow to run. As long as any enrichment workflow has viable input to process, it will return enriched content for your security teams to use.
Enrichment workflows rely on several third party and open source plugins to process your investigation data; ensure you have installed and activated an Rapid7 Orchestrator (Insight Orchestrator).
Enable File Integrity Monitoring (FIM)
File Integrity Monitoring (FIM) allows you to audit changes to critical files and folders for compliance reasons on Windows systems running agent version 2.5.3.8 or later.
When you turn on FIM, the Rapid7 Agent (Insight Agent) starts collecting FIM events. SIEM (InsightIDR) can then attribute users to file modification activity. You can create alerts based on certain file log events to notify you when one of your users modifies a critical file or folder.
How to configure FIM
- Review the Windows or Linux requirements.
- Turn on FIM in SIEM (InsightIDR).
- Follow the configuration steps for a Windows or Linux environment.
Deploy the Network Sensor
During your first 45 days, you deployed Rapid7 Agents (Insight Agents) and Collectors to monitor your assets for vulnerabilities and user behavior. While these components are responsible for collecting data on your assets, they do not account for network traffic, which is the data moving between your assets. To provide the network traffic visibility that you need for network traffic analysis (NTA), Rapid7 offers the Rapid7 Network Sensor (Insight Network Sensor) with multiple deployment options.
The Rapid7 Network Sensor (Insight Network Sensor) allows you to monitor, capture, and assess the end-to-end network traffic moving throughout your physical and virtual environment. SIEM (InsightIDR) can then leverage this network sensor data for network traffic analysis and IDS (Intrusion Detection System) detection rules.
Network Sensor deployment options
There are 3 options for deploying the network sensor. All options offer network traffic visibility, but are deployed and configured differently.
- The Rapid7 Network Sensor (Insight Network Sensor) deployed on a physical server
- The Rapid7 Network Sensor (Insight Network Sensor) deployed on a virtual machine
- The Rapid7 Network Sensor (Insight Network Sensor) for AWS, which is deployed on an EC2 instance
To deploy an Rapid7 Network Sensor (Insight Network Sensor), see the Rapid7 Network Sensor (Insight Network Sensor) Deployment Guide.
How IDS detection rules work
Intrusion Detection System (IDS) is an application that monitors for malicious activity and policy violations on your network. When configuring this event source in SIEM (InsightIDR), the IDS data is attributed to the user and asset details page and allows you to search through the data. However, it does not produce alerts.
SIEM (InsightIDR) can collect events from these types of IDS/IPS devices:
- Cisco FirePower
- Corero IPS
- Dell iSensor
- F5 Networks BIG-IP Local Traffic Manager
- HP TippingPoint
- Juniper Junos
- McAfee IDS
- Metaflows IDS
- Security Onion
- Sentinel IPS
- Snort IDS
- Network Sensor
To collect IDS/IPS events, you need to configure the device to send syslog to the Collector. For a detailed list of the rules used to identify suspicious activity, see IDS detection rules powered by the Rapid7 Network Sensor (Insight Network Sensor).
Day 90+: Continue your SIEM (InsightIDR) Exploration and Education
Discovering new aspects of SIEM (InsightIDR) doesn’t stop after your first 90 days! Rapid7 has workshops, monthly product updates, and in-product messages to keep you informed about new features and the value you can gain from them.
The Rapid7 Academy
The Rapid7 Academy holds trainings, webcasts, workshops, and more, all led by our Rapid7 experts.
- On-demand training helps you get started with Rapid7 products, answer frequently asked questions, and recommend best practices.
- Rapid7 Webcasts are hosted by Rapid7’s product teams and provide a forum where customers can learn about best practices as well as what’s new in their Rapid7 products.
- Virtual Instuctor-Led Training Courses are live training sessions broken down by product and available for enrollment.
- Certification Exams are product-specific exams to help you demonstrate your knowledge of using Rapid7’s solutions as a cybersecurity professional.
- Product Workshops are Rapid7’s free trainings on all things, all products, and average about an hour long.
Communications
To make sure you receive the Rapid7 communications that best suit your needs, set your communication preferences.
- Whether it’s an emergent cybersecurity threat, a product update, or a notice of service degradation for maintenance, we’ll alert you with an in-product message to ensure you’re aware of all that affects your environment.
- Rapid7’s research provides information on a variety of topics, such as, cloud misconfigurations, vulnerability management, detection and response, application security, and more.
- Rapid7’s blog offers conversational guidance and information from our security experts.
- SIEM (InsightIDR)‘s Release Notes and in-product What’s New guides are published at the end of each month to notify you of the product updates, improvements, and bug fixes that have occurred during the month.
Our Communities
Rapid7 supports a range of open-source projects. Consider joining one of our Open-Source communities!
- AttackerKB captures, highlights, and expands on security researcher knowledge to shed light on the specific conditions and characteristics that make a vulnerability exploitable and useful to attackers.
- Velociraptor provides you with the ability to more effectively respond to a wide range of digital forensic and cyber incident response investigations and data breaches.
- Metasploit empowers and arms defenders to stay one step ahead of the game by verifying vulnerabilities, managing security assessments, and improving security awareness.
- Recog is a framework for identifying products, services, operating systems, and hardware by matching fingerprints against data returned from various network probes.
Our customer advocacy program, Rapid7 Voice, provides you with a network of customers, offers the chance to deepen your security expertise, and provides the opportunity to share input on future product developments.
Rapid7 Support
When you run into any problems with SIEM (InsightIDR), first search our help site for potential solutions. If you need additional assistance, please contact Rapid7 Support through the customer portal.