This product is no longer sold. We no longer update these help pages, so some information may be out of date.
Analytic Packs
Analytic Packs provide a time-efficient and convenient way for you to search and manage your logs with preconfigured queries, tags, alerts, and dashboards. You can apply an Analytic Pack to your logs as is, or customize a Pack to fit your needs.
To get started using Analytic Packs:
Choose an Analytic Pack
To choose an Analytic Pack:
- Navigate to Log Management (InsightOps).
- On the left menu, select the Analytic Packs page.
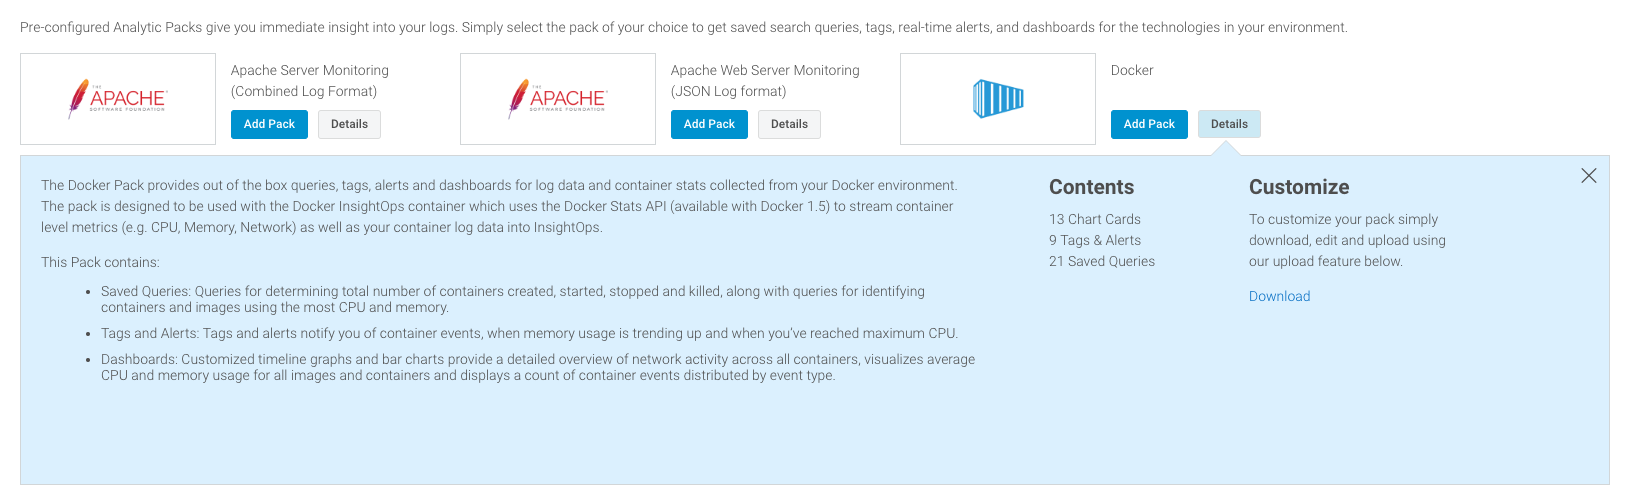
- Find the Pack you want to use and click the Details button to read more about each Pack.
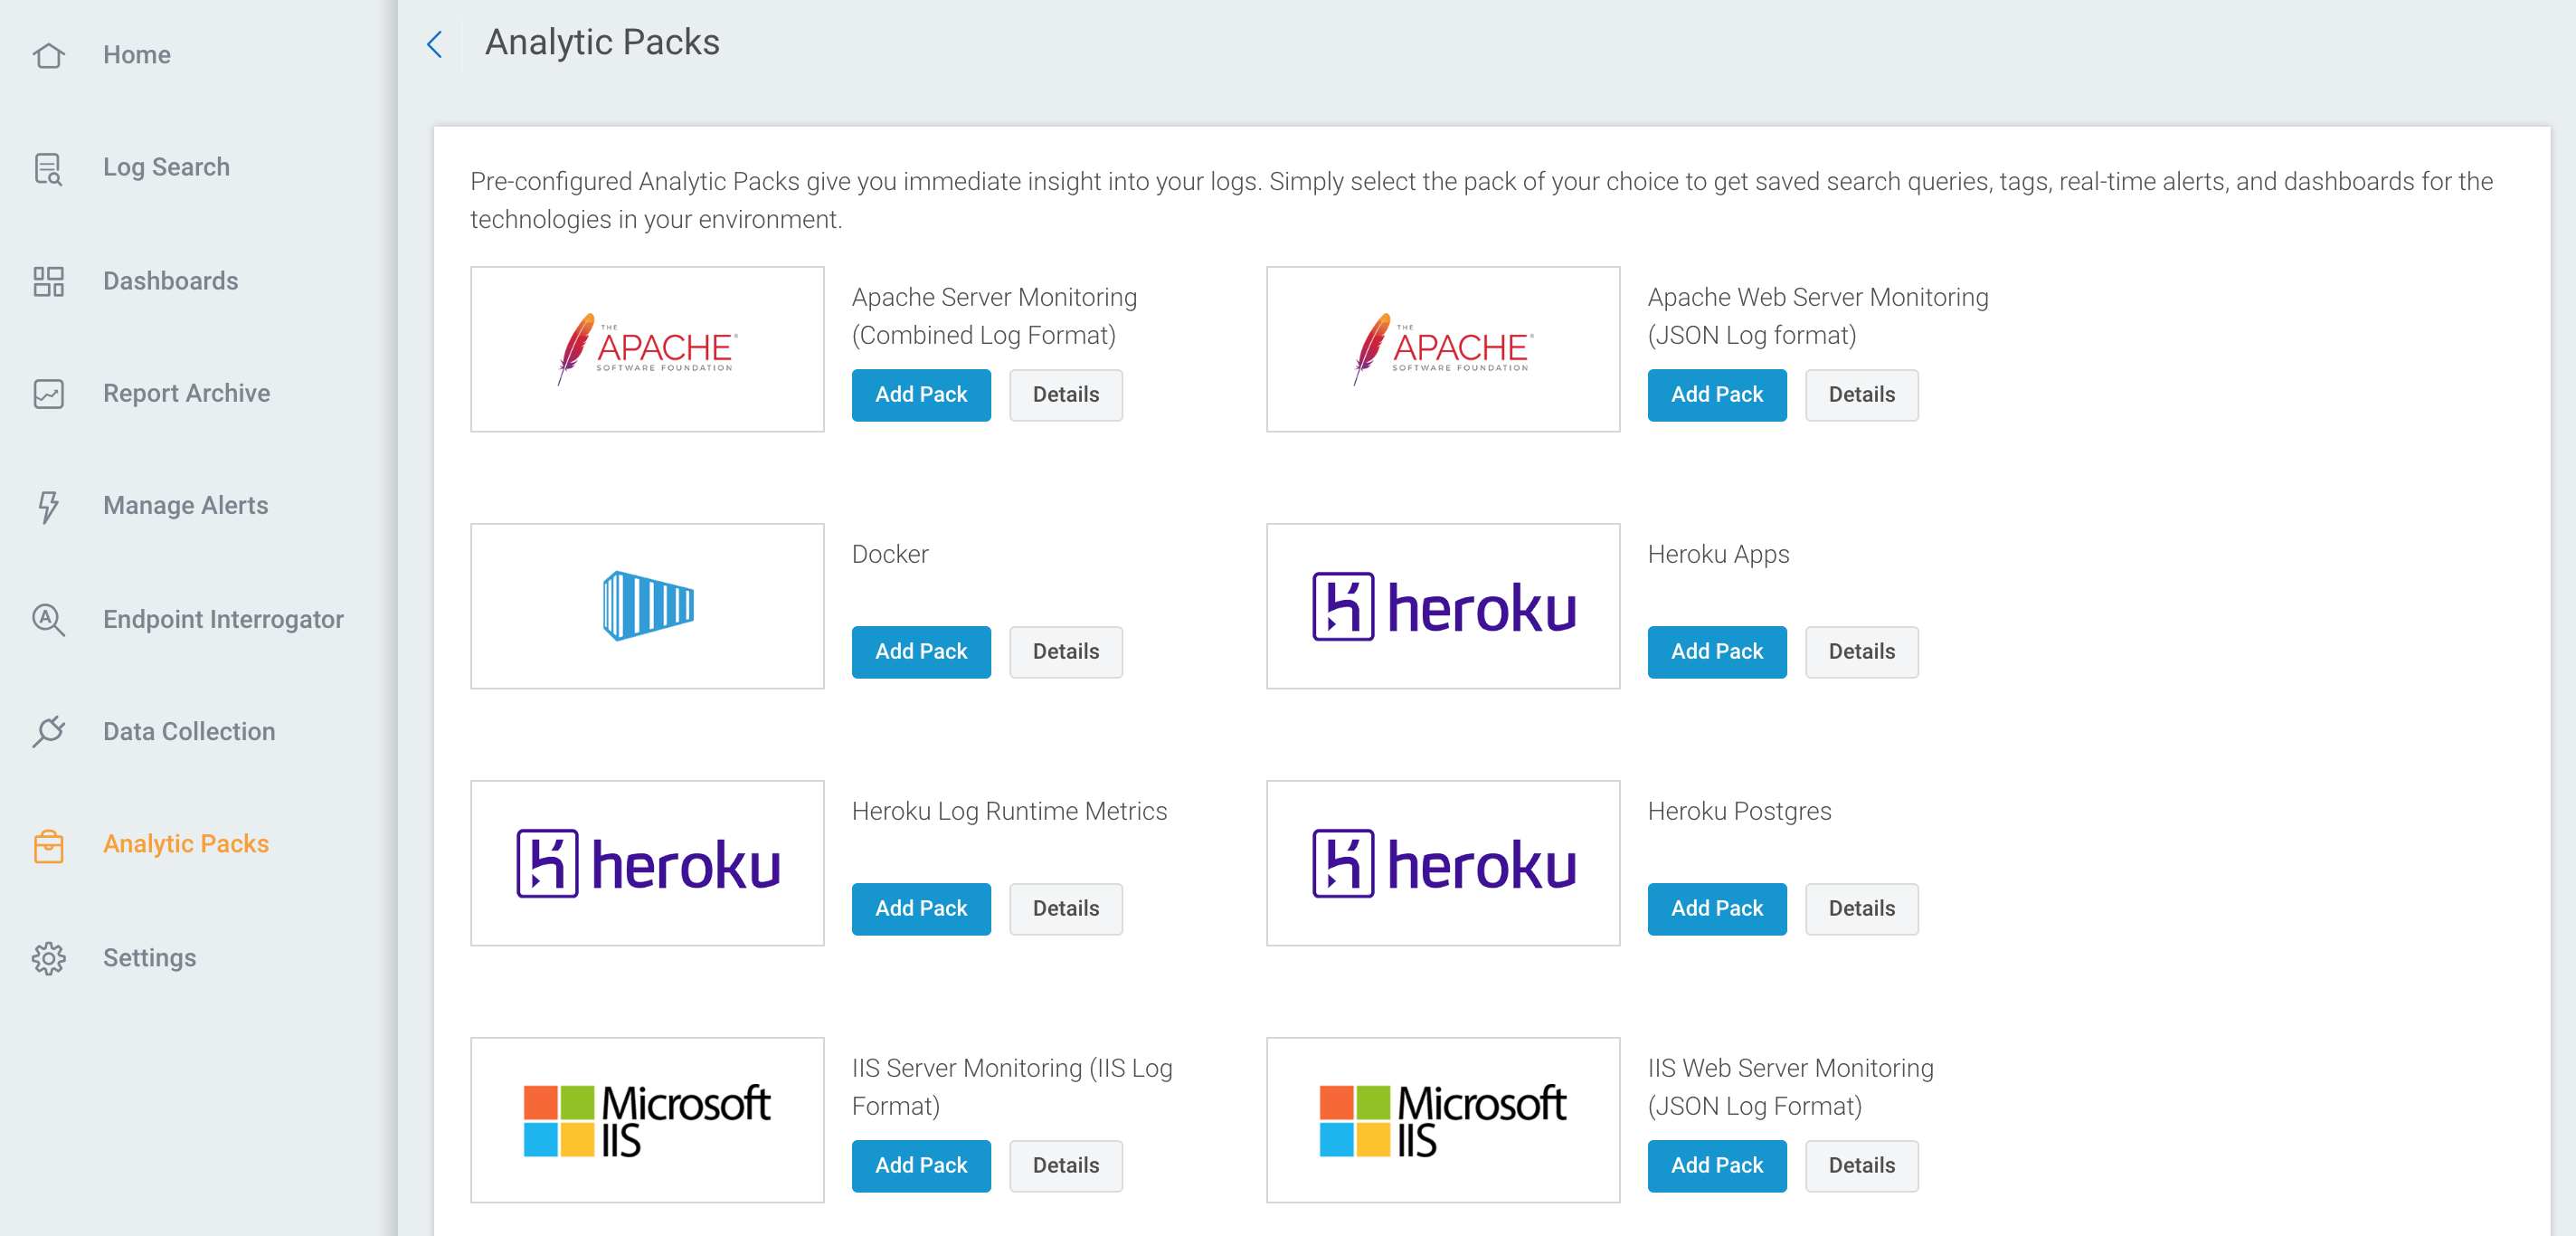
The Analytic Packs you can configure are:
- Apache Server Monitoring (Combined Log Format): uses the Automated Log Parsing functionality in Log Management (InsightOps) to extract values from the Combined Apache Log Format.
- Apache Web Server Monitoring (JSON Log format): extracts key points of interest from your web logs and exposes them in visualizations available as dashboard items.
- Docker: uses the Docker Stats API (available with Docker 1.5) to stream container level metrics (such as CPU, Memory, and Network metrics) and your container log data into Log Management (InsightOps).
- Heroku Apps: identifies and tracks important events as defined here https://devcenter.heroku.com/articles/error-codes , and provides visibility into latency metrics for your apps.
- Heroku Log Runtime Metrics: provides visibility into the Heroku runtime metrics that can be enabled for your Heroku apps.
- Heroku Postgres: helps database administrators and application developers understand their application behavior and analyze important processes occurring between the app and database.
- IIS Server Monitoring (IIS Log Format): extracts values from the default IIS Log Format.
- IIS Web Server Monitoring (JSON Log Format): extracts key points of interest from your web logs and exposes them in visualizations available as dashboard items.
- KeyCDN Monitoring: includes powerful tags, saved queries, and visualizations to enable quick and easy management and analytics of KeyCDN logs.
- Linux Server Monitoring: provides out of the box tags, alerts, saved queries, and dashboards for server resource usage information collected by the Rapid7 Rapid7 Agent (Insight Agent).
- Microsoft DHCP: contains pre-configured tags, saved queries, and dashboards to help you maintain and troubleshoot your Microsoft DHCP Server environment.
- Microsoft SQL Server: contains pre-configured tags, saved queries, and dashboards to help you maintain and troubleshoot your Microsoft SQL Server environment.
- MongoDB 3.0 Database Monitoring: provides visibility into database activity analytics and the severity level and component associated with each log message.
- NGINX Server Monitoring (Combined Log format): uses the Automated Log Parsing functionality in Log Management (InsightOps) to extract values from the Combined NGINX Log Format.
- NGINX Server Monitoring (JSON Log format): extracts key points of interest from your web logs and exposes them in visualizations available as dashboard items.
- Puppet Console Logs: use on specific log files generated by Puppet.
- Puppet Database Logs: use on specific log files generated by Puppet.
- Puppet Live Management: use on specific log files generated by Puppet.
- Puppet Master Logs: use on specific log files generated by Puppet.
- Python APM: works with the metrics extension available in the Log Management (InsightOps) Python Library (https://docs.logentries.com/docs/python/ ).
- Salesforce: provides visibility into your salesforce login, loginAs and logout events.
- Syslog for Ubuntu: uses the native Ubuntu 14 and Ubuntu 12 logging capabilities and can be used to analyze log files for authentication, boot, kernel, and system logs.
- Windows PCI Compliance: contains pre-configured tags, saved queries, and dashboards to use in tandem with Auditing Policies to help maintain your PCI Compliance.
- Windows Security Events: provides tags for important events that occur in your Windows security event logs and error codes for Windows 2003, 2008, and 2012.
Install an Analytic Pack
Once you’ve decided which Analytic Pack you want to install, complete the following steps:
- Click the Add Pack button. The “Set Up Your Analytic Pack” wizard appears.
- Select which logs you want to use with the Pack and click the Next: Tags & Alerts button.
- Select which tags and alerts you want to use with the Pack and click the Next: Saved Queries button.
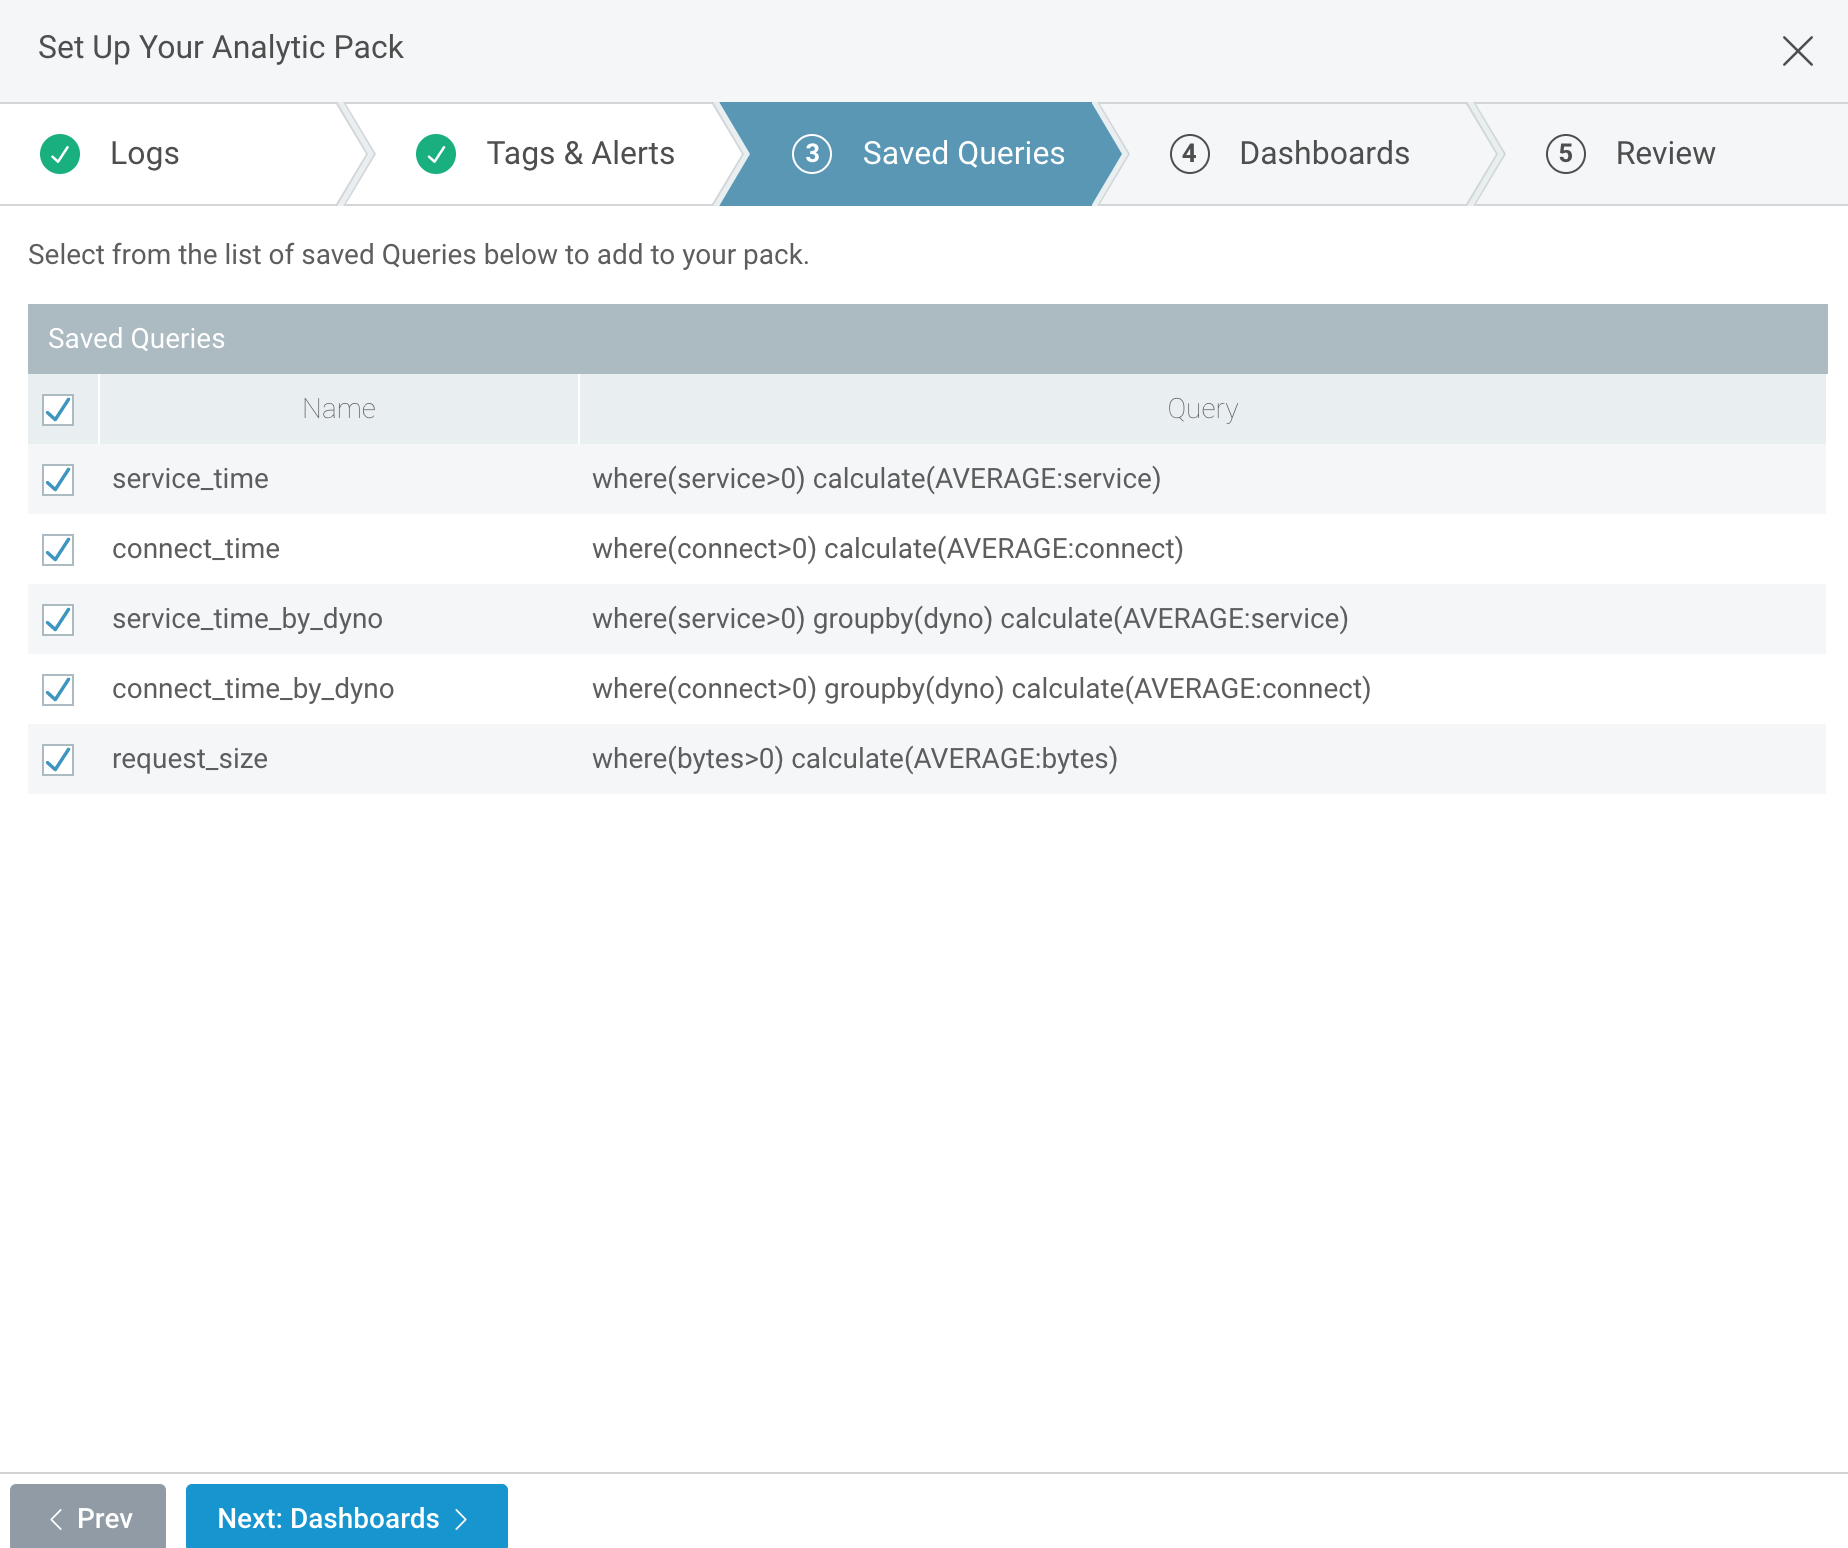
- Select which saved queries you want to use with the Pack and click the Next: Dashboards button.
- Select which cards you want to use with the Pack and click the Next: Review button.
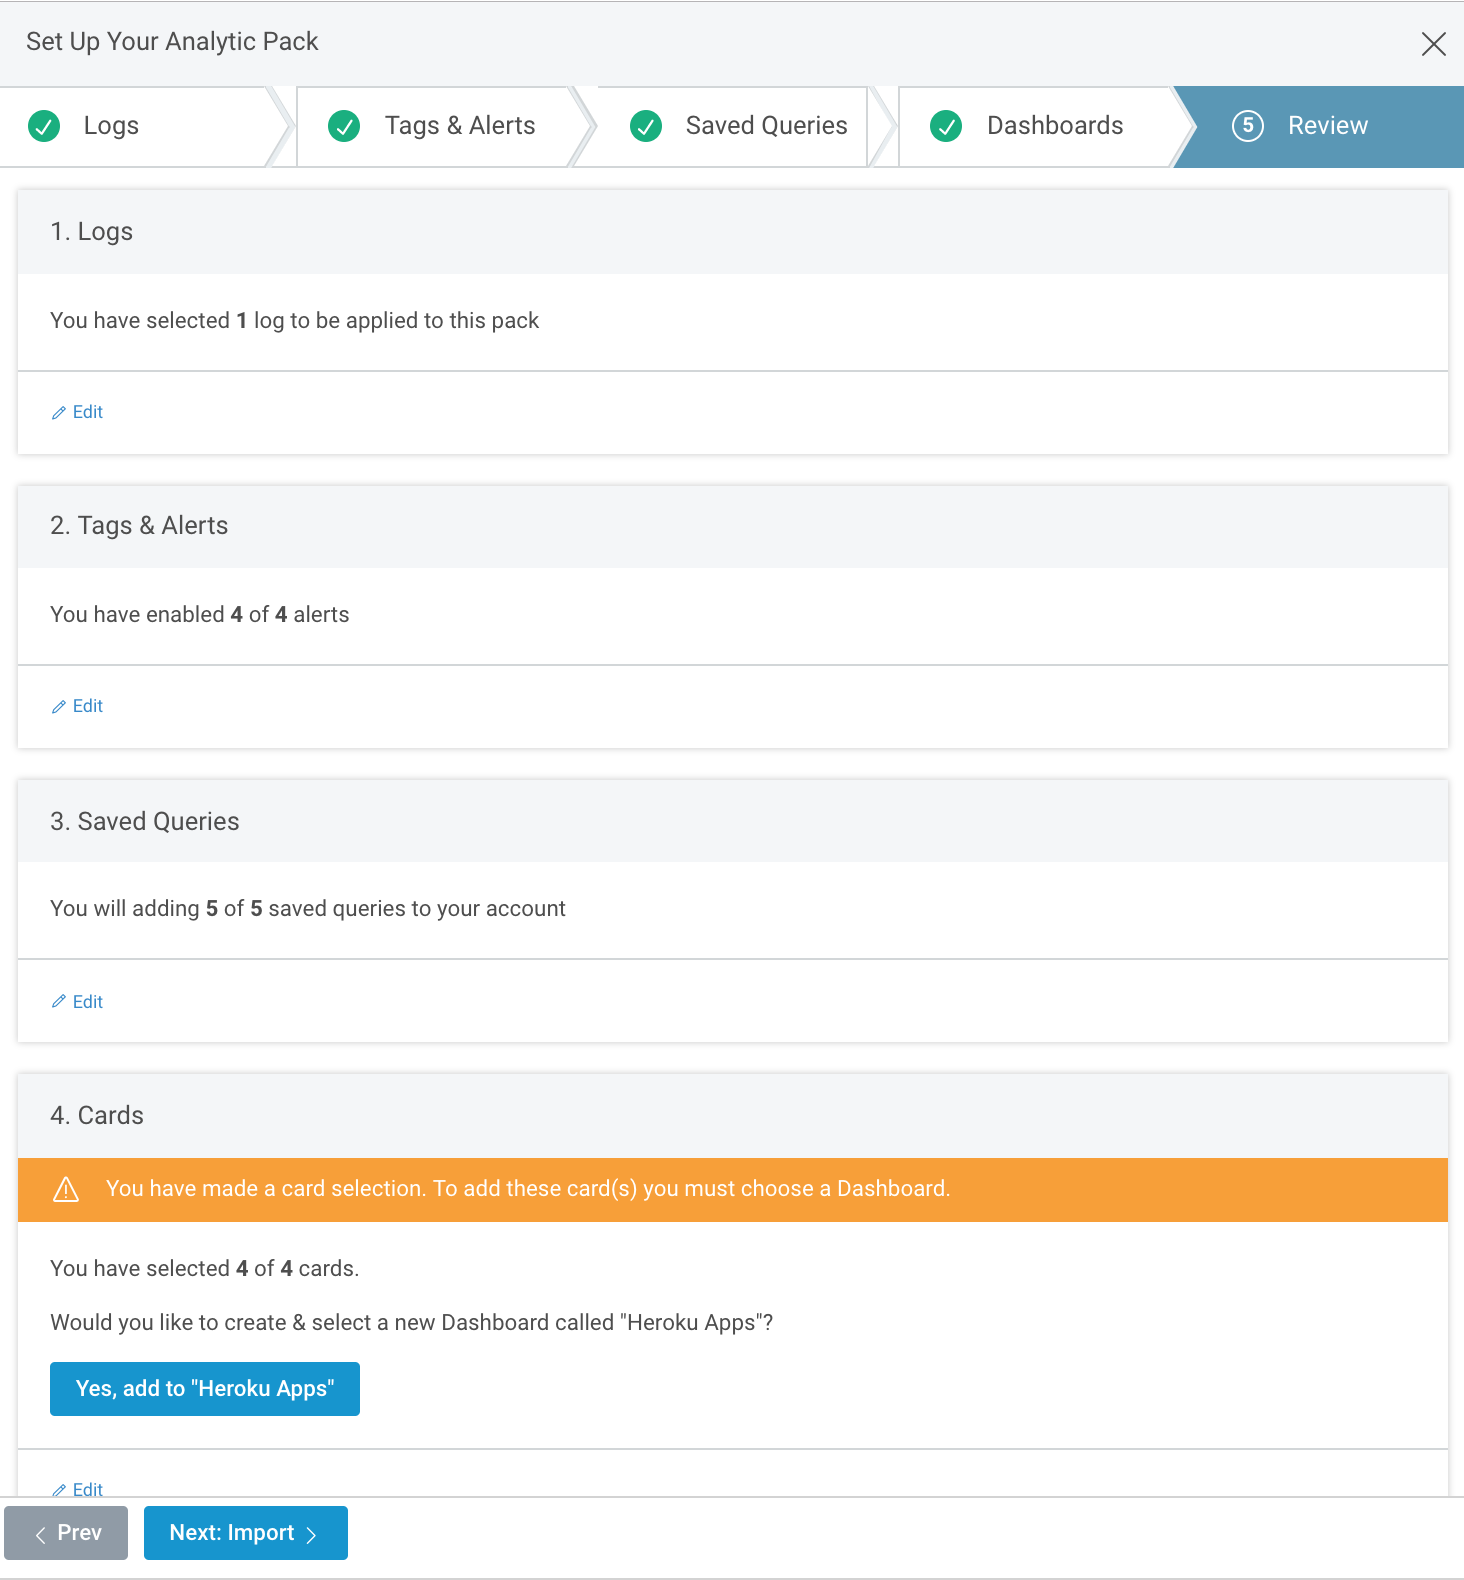
- Review the choices you made for your Analytic Pack. When everything looks good, select the Next: Import button.
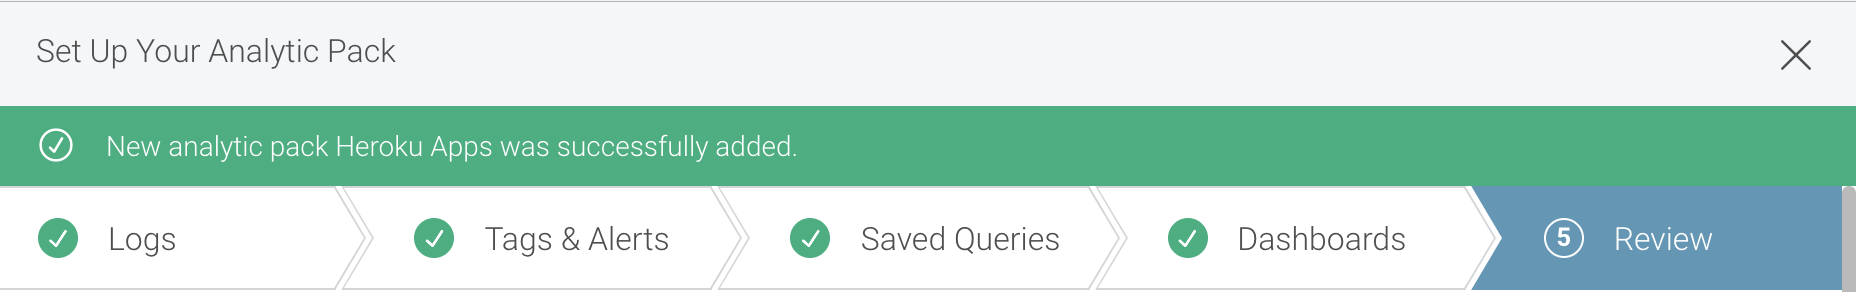
You will now see the relevant alerts, tags, dashboard cards, and logs across Log Management (InsightOps).
Use Pack Defaults
When configuring an Analytic Pack, you also have the option to use all the default selections for a rapid set up.
To use Pack defaults:
- Click the Add Pack button. The “Set Up Your Analytic Pack” wizard appears.
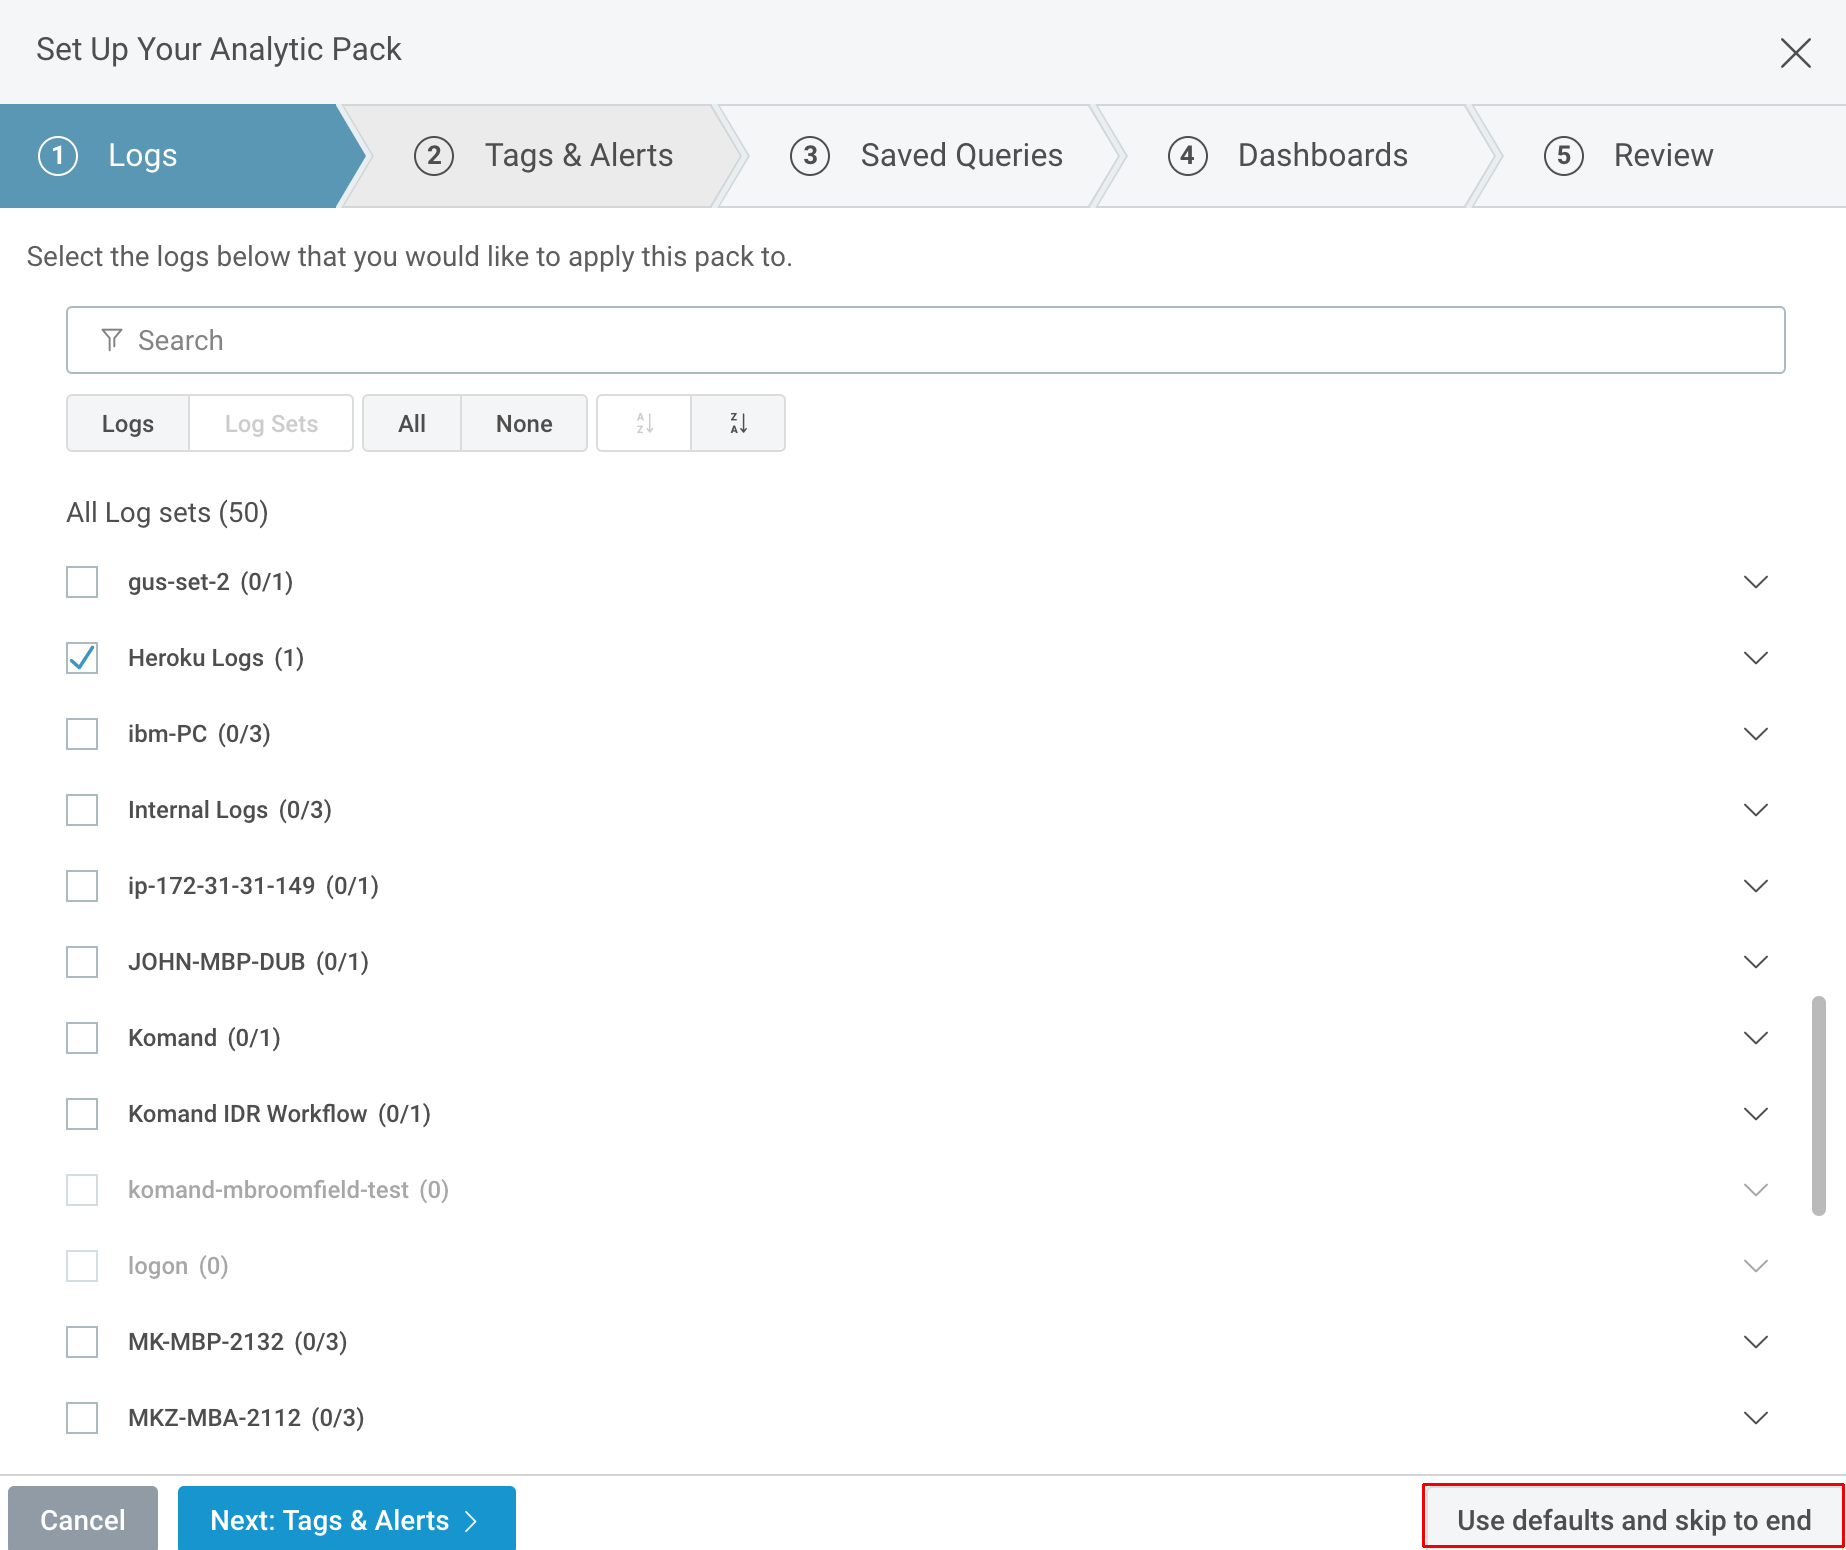
- Select which logs you want to use with the Pack and then click the Use Defaults and Skip to End button. All sections of the setup wizard will have green checkmarks.
- Review the final configuration of your Analytic Pack and click the Next: Import button.
You will now see the relevant alerts, tags, dashboard cards, and logs across Log Management (InsightOps).
Verify the Configuration
To verify your changes and configurations, you can check for your Analytic Pack in a few different places:
- On the “Log Search” page, select the Queries option from the query builder to display the new queries.
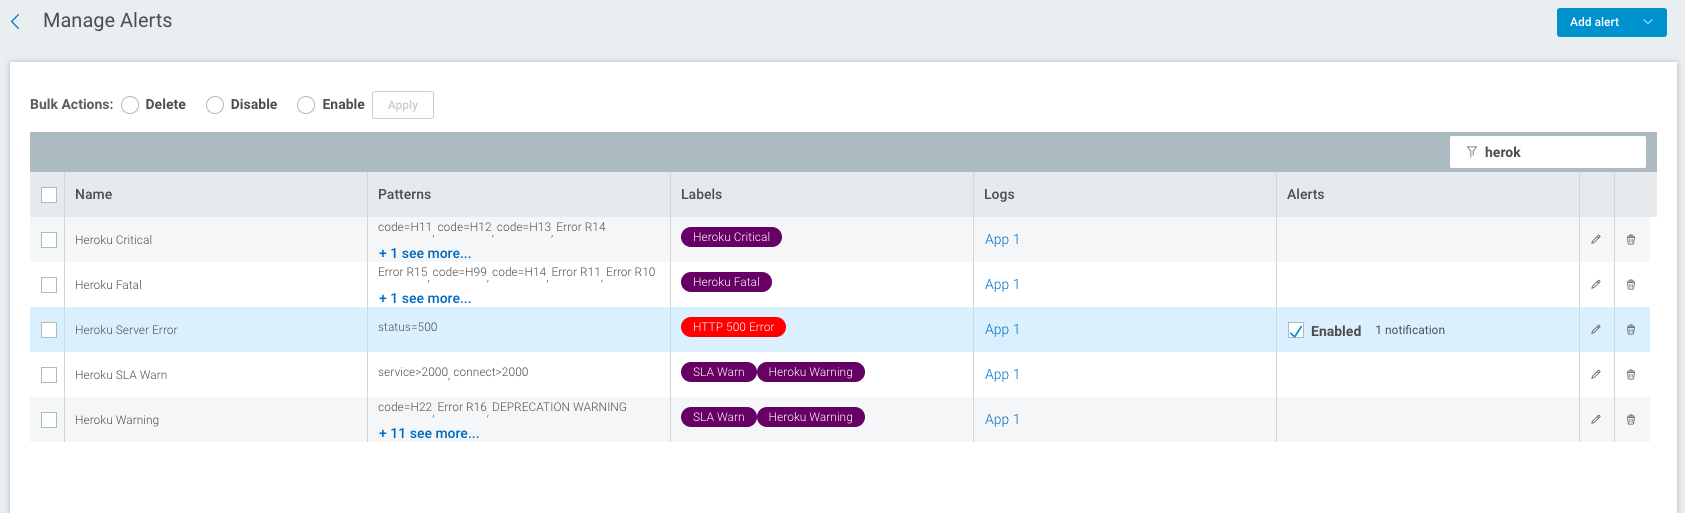
- On the “Manage Alerts” page, you will see the new alerts based on the name of the Analytic Pack you installed. You can edit these alerts as necessary.
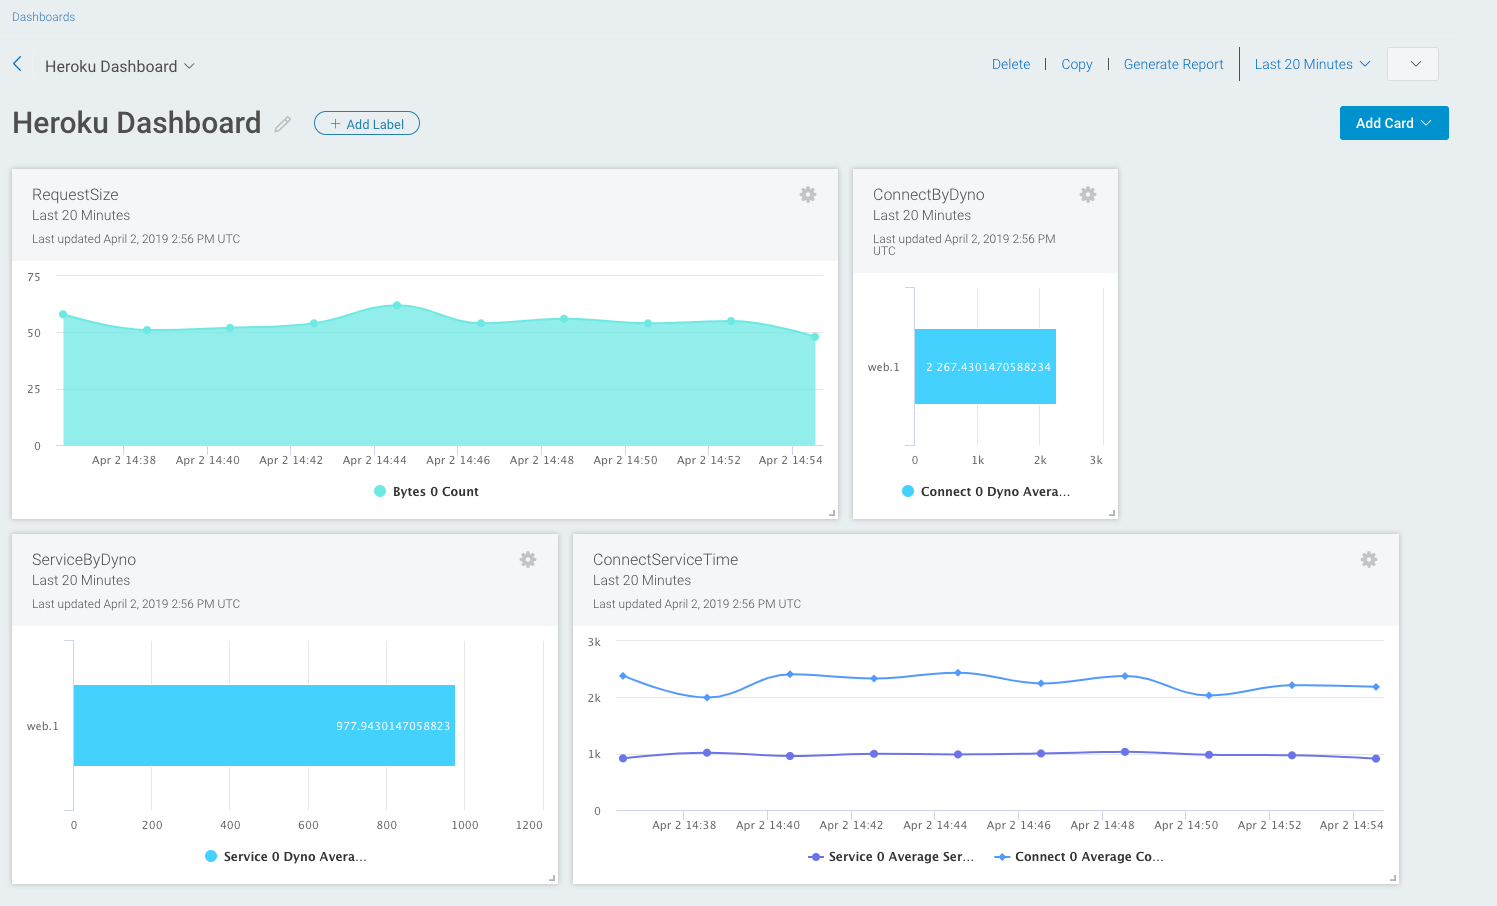
- On the “Dashboards” page, you will see a new dashboard based on your dashboard selection during the “Review” step of the Analytic Pack setup wizard. Customize the dashboard and cards as necessary.