⚠️
This product is no longer sold. We no longer update these help pages, so some information may be out of date.
Create Dashboards and Reports
Step 4: Create Dashboards and Reports
With dashboards and reports, you can visualize your data with widget charts and graphs that help you identify important trends. You can also:
- Create live dashboards that auto-refresh every 5 minutes or at other set intervals.
- Correlate log data with metrics and asset data.
- Schedule and save automated reports for compliance requirements or executive reporting.
Create a Dashboard
Dashboards are a collection of individual visualizations (i.e. widgets). Note: You need to create dashboards before generating reports.
- Click the Dashboard icon on the left-side navigation bar.
- Click Create.
- Enter a name for your dashboard.
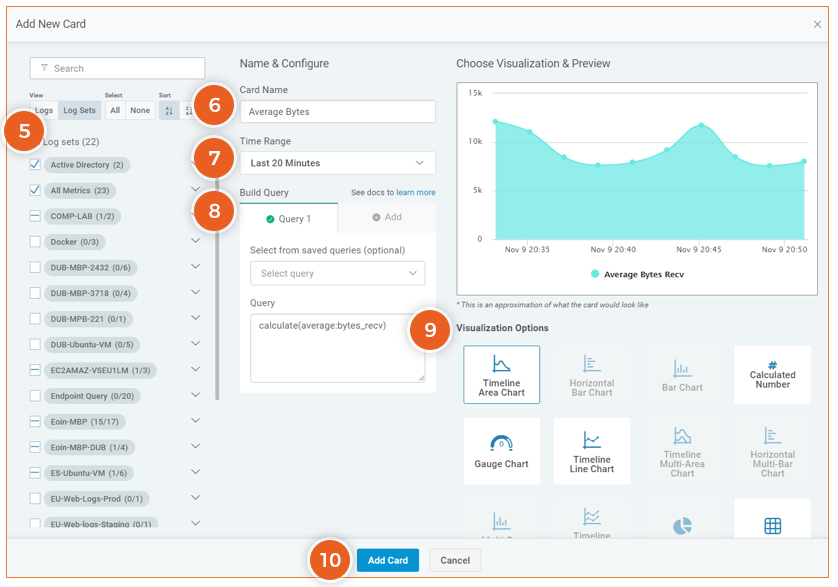
- Click the Add Widget button and select Build your own from the drop-down menu.
- Choose the log(s) or log set(s) against which you want to run your query.
- Enter a widget name.
- Select the time range for which the data will be queried.
- Build a query using an analytic function, such as
where(keyword) calculate(count). Or choose from a list of previously saved queries. 9 Choose a Visualization to see a preview of the widget. - Click Add Widget.
Learn more about Dashboards
Create a Report
Once you’ve created a dashboard, you can generate reports.
- Open an existing dashboard.
- Click the Generate Report button.
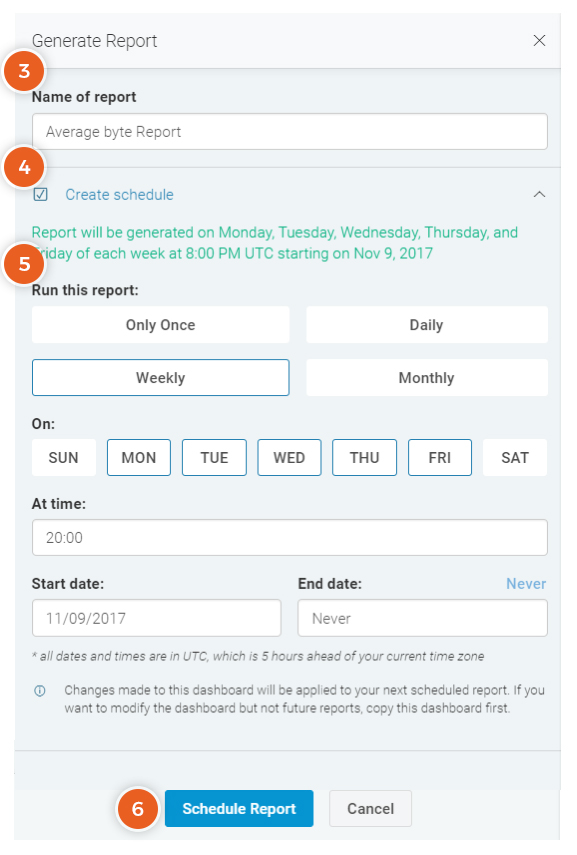
- Enter a name for your report.
- Check the Create schedule box to generate reports on a regular basis.
- Note: You can also produce ad-hoc reports by clicking the Generate Report Now button.
- Select the frequency, time, and date ranges in which you would like the report to be generated.
- Click Schedule Report.
- To view your reports, click the Report Archive icon on the left-side navigation bar.
Learn more about Reports.