This product is no longer sold. We no longer update these help pages, so some information may be out of date.
Dashboards
Log Management (InsightOps) allows you to create Dashboards visualizations based on your LEQL queries to gain better insight into your log data.
Manage Dashboards
Users can manage their Dashboards on the Manage Dashboards page. From here you can create, filter, view or delete a Dashboard.
Labels can also be created for Dashboards to allow you to group or identify your Dashboards.
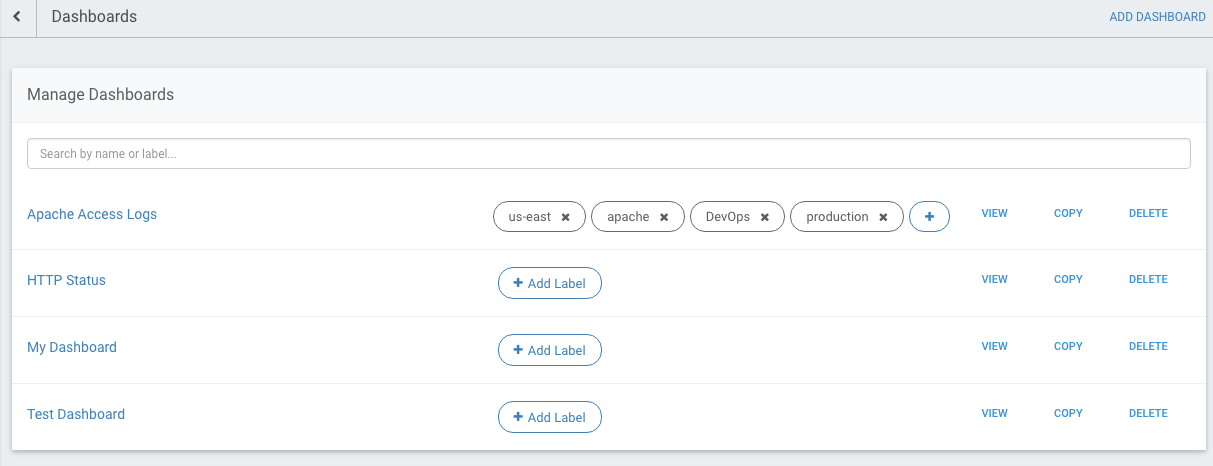
Add Dashboards
You can create a new dashboard by clicking Add Dashboard on the Dashboards tab.

Creating dashboard widgets
After creating a Dashboard you can begin adding widgets to it. Simply go to a Dashboard and press the Add a Widget button.
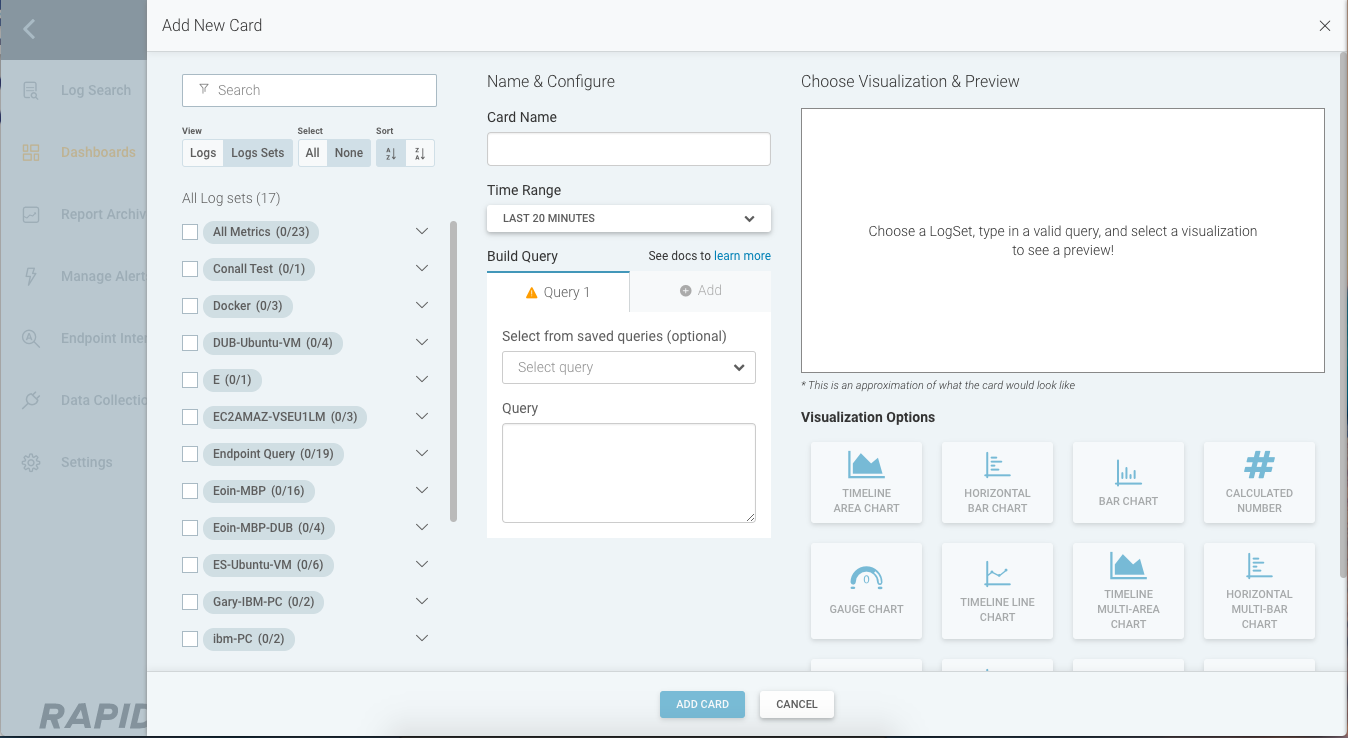
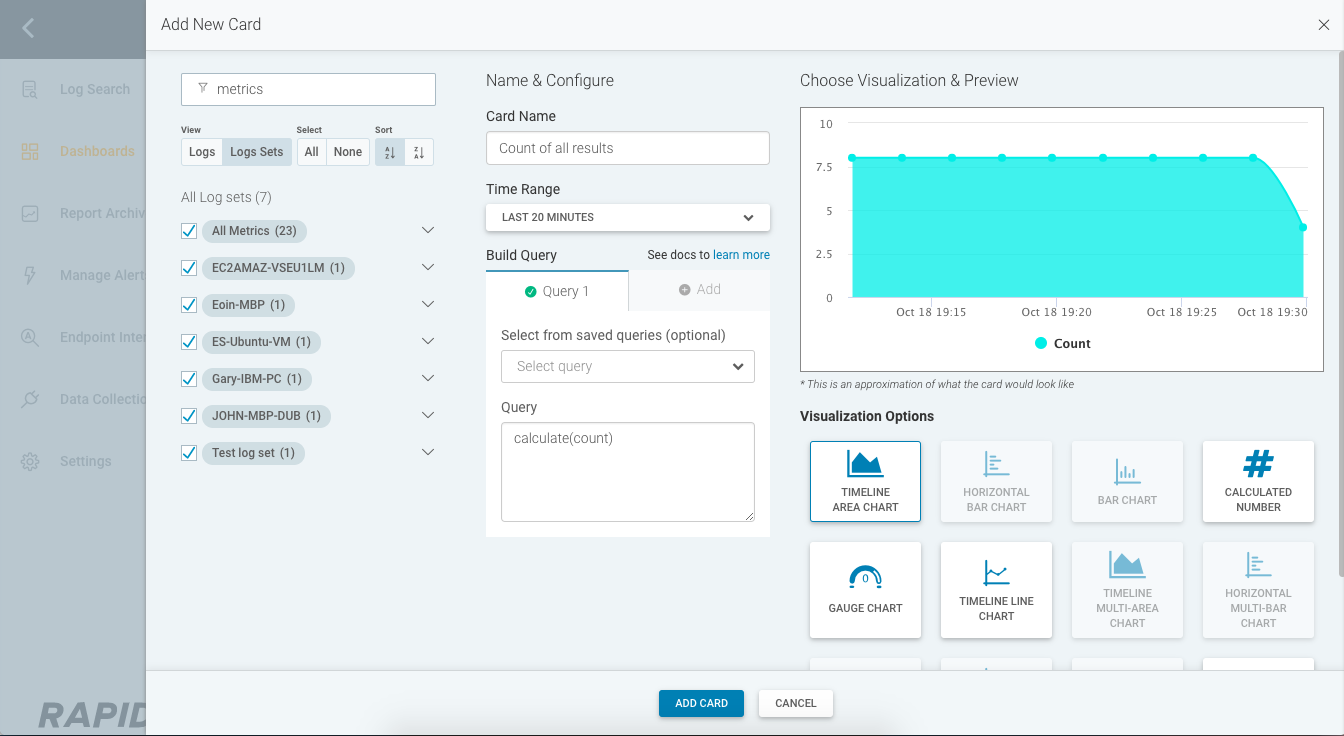
From here you select the Log(s) you wish to run your query against. Once you have selected your logs simply create a name for your widget and add in your LEQL Query. You can also choose from a list of saved queries.
Finally select the Visualization Option you wish to use. Charts that are not compatible with your query will be greyed out.
After selecting an option you will see a live preview of the results of your query.
When you save the widget, it will be displayed on your dashboard
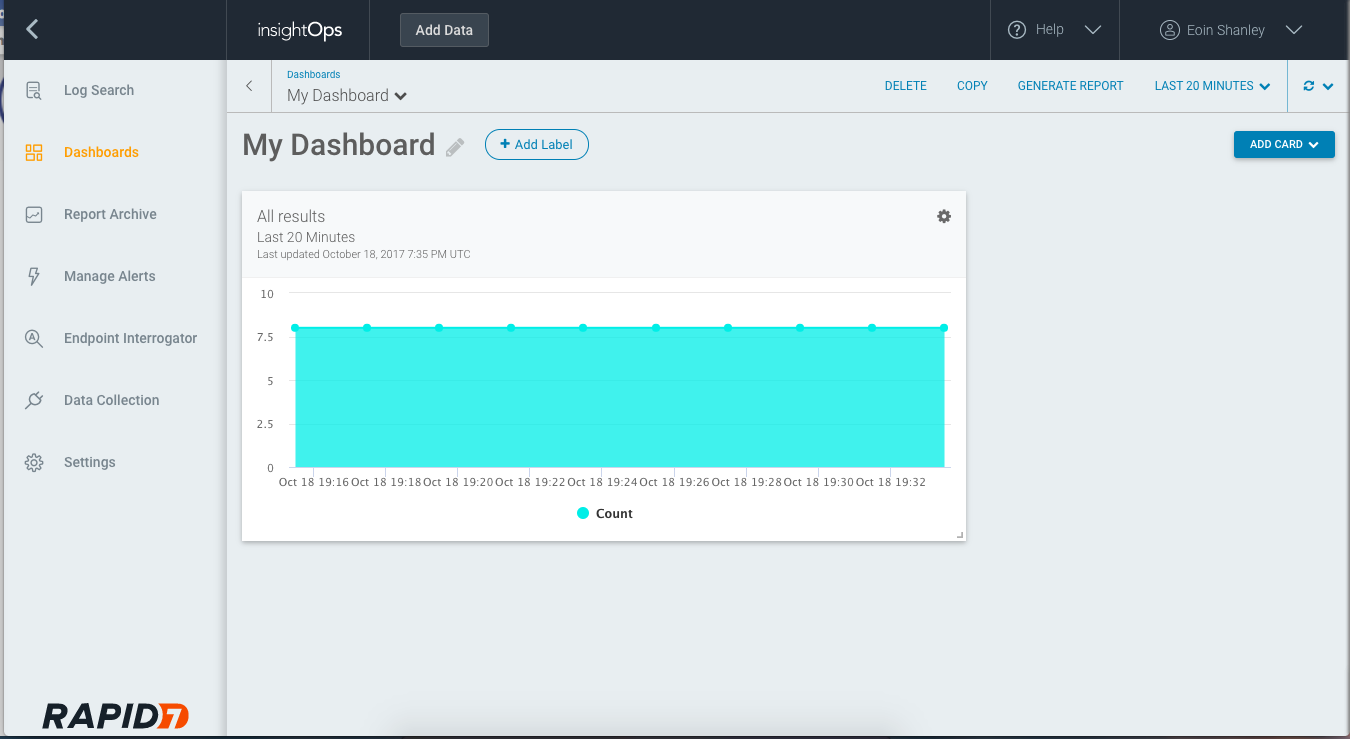
Refresh Your Data
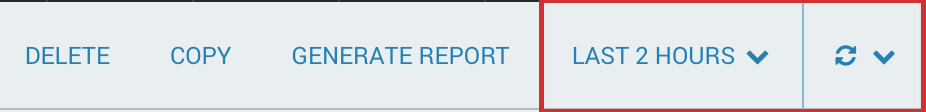
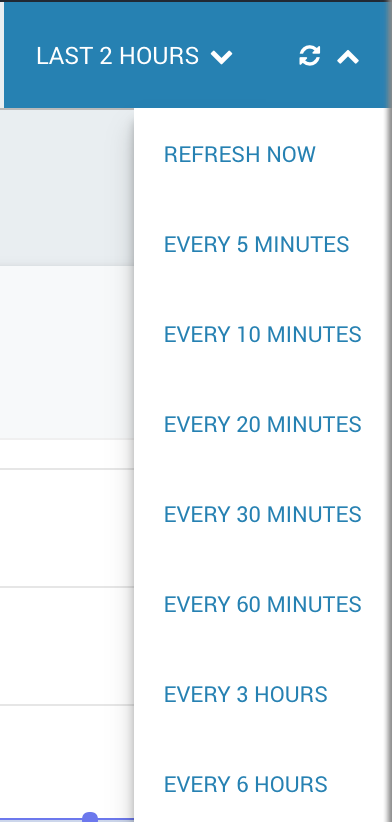
Once your dashboard is configured and saved, you can see when the dashboard was last refreshed and then select an option for when to refresh the data.
Report
If you want to see this results in a PDF format, or for them to be generated on a schedule, you can do that by scheduling reports.