This product is no longer sold. We no longer update these help pages, so some information may be out of date.
Visual Search
Visual Search allows you to get visibility into your log data without having to perform any pre-configuration. With Visual Search, you can quickly find hidden pieces of information in your logs, visualize large amounts of data over a wide time range, filter and drill-down your data, and take action on important events. You can also control visualizations by changing the time range.
Get Started
Visual Search works by automatically parsing your log data and selecting the 2 most frequently occurring keys in your selected log(s). Log Management (InsightOps) generates visualizations based on these keys, and displays a timeline of matching search results above your log data.
To view your visualizations:
Go to Log Search, select a log, and click the Visualizations tab.
Add new visualizations
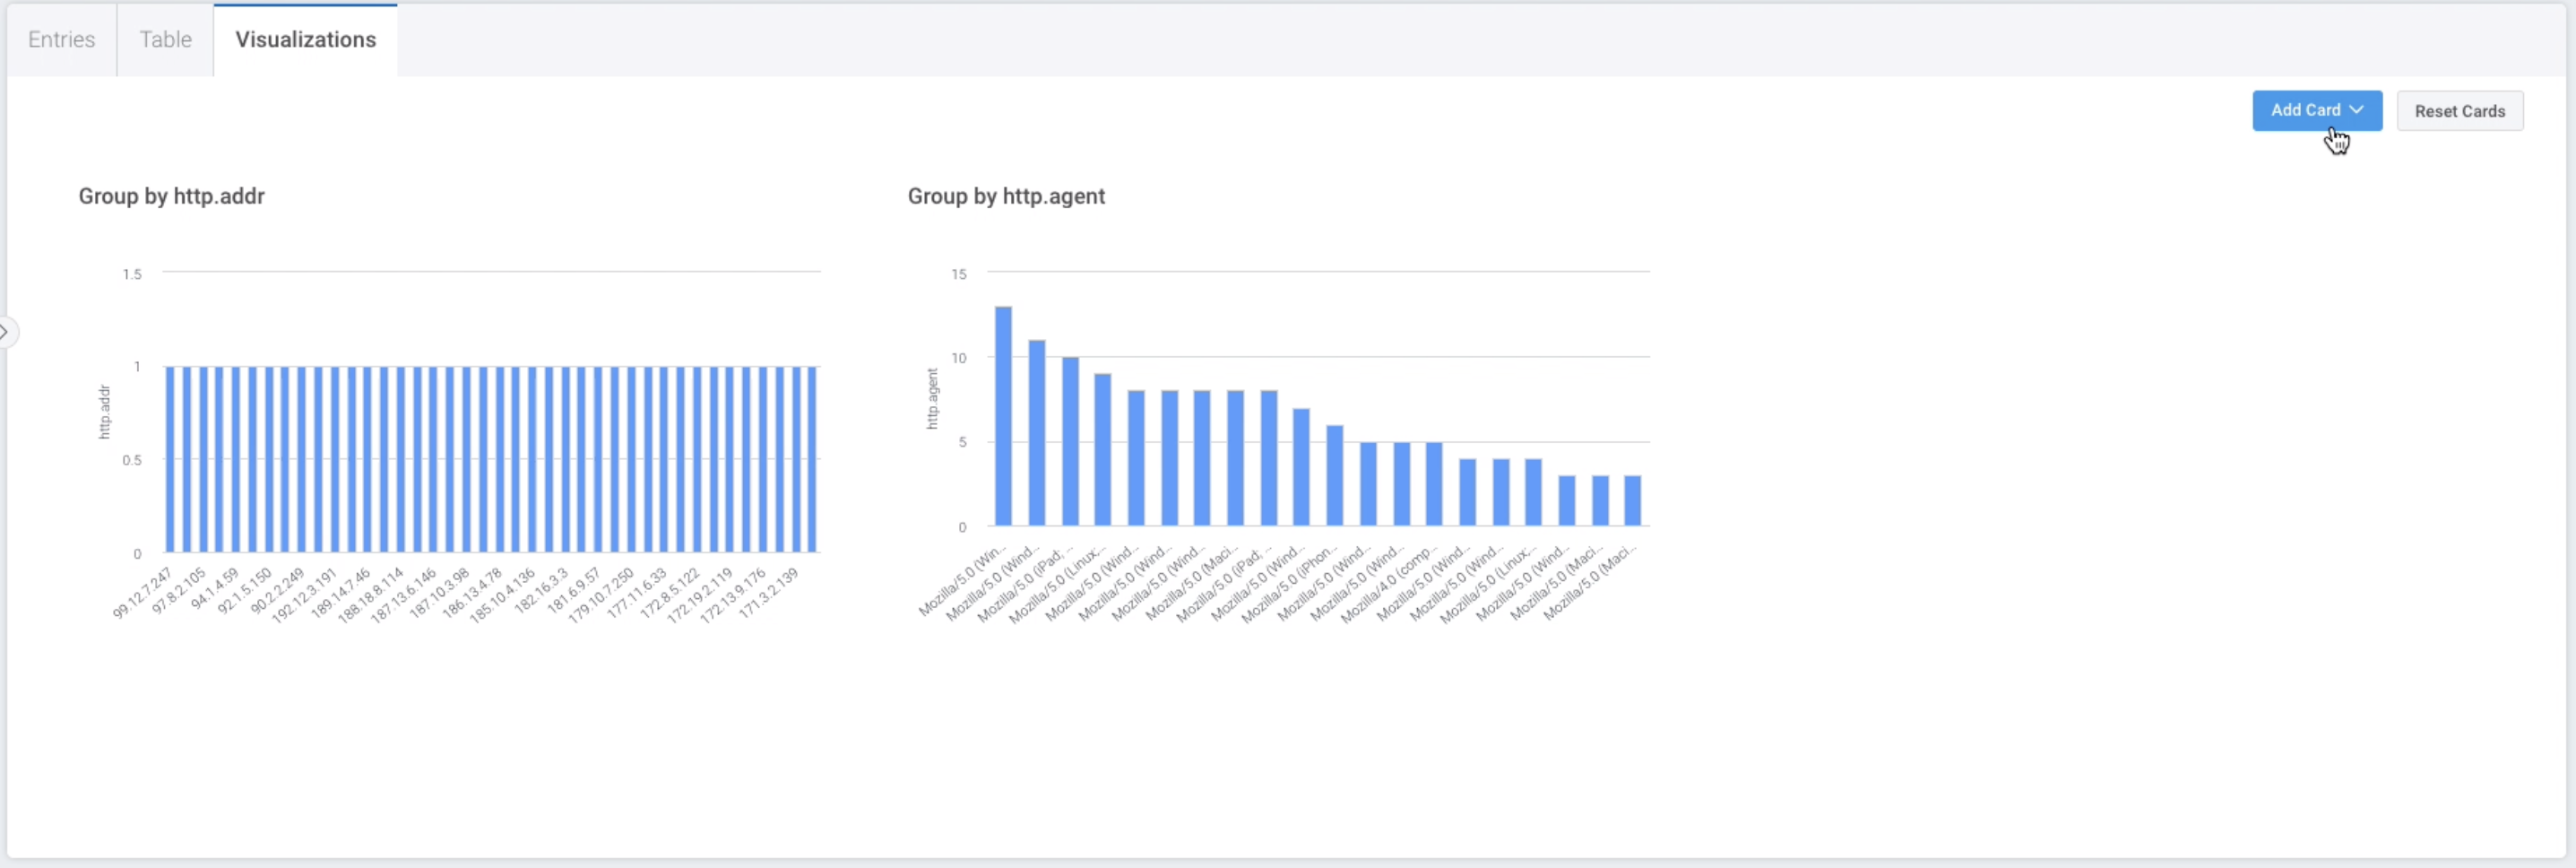
You add a new visualization from the Visualizations tab of your selected log(s).
- Click the Add Widget button.
- Select or enter a key to visualize.
- Select a graph type.
- To save your visualization, click Add Widget again.
Configure your Visualizations
You can configure the type of visualization displayed in Visual Search mode by clicking on the cog settings button on the specific visualization you wish to edit.
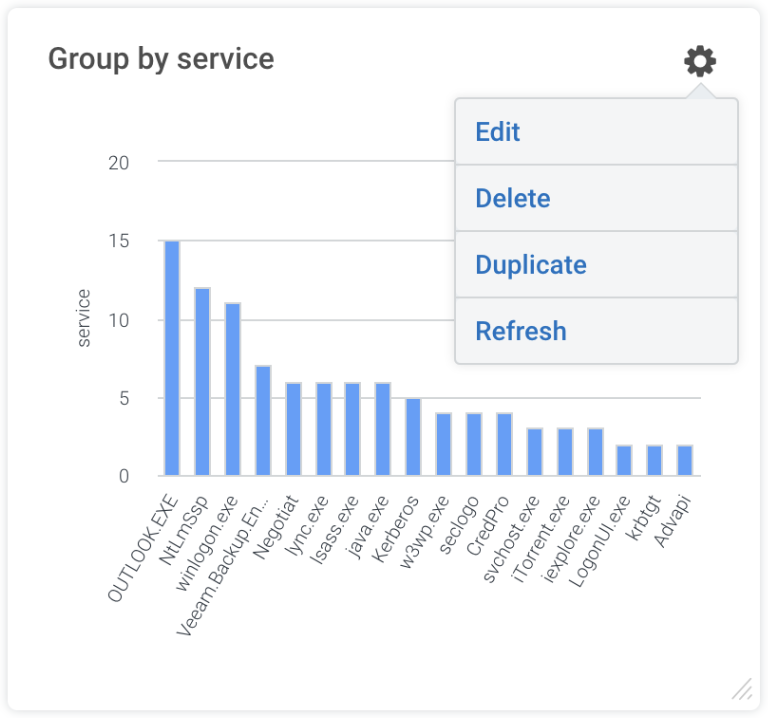
From here you can can configure the following items:
- The name of visualization.
- The calculation that is to be run.
- The type of chart to be used to render your query result.
Interact with your visualizations
Visualizations are interactive, which means you can update your query by selecting a data point on any of your widgets to filter the search results. Widgets will automatically update based on how they relate to your selection.
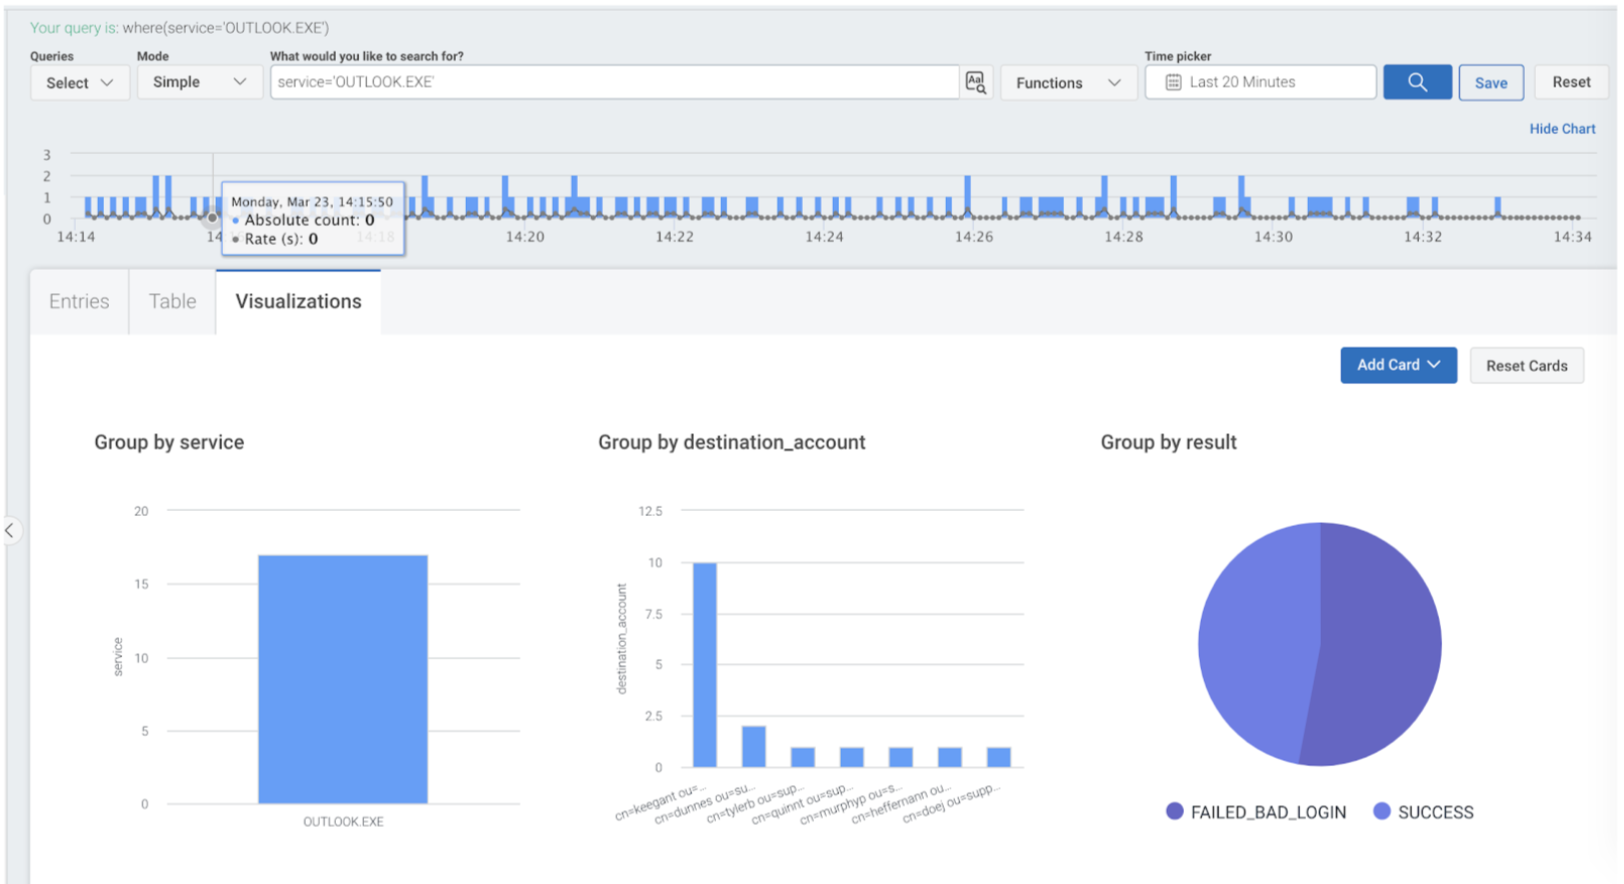
To drill into a particular value simply click on the series in the visualization. In the below example we drilled into a bar chart to show us the results of all entries where the service was “OUTLOOK.EXE”
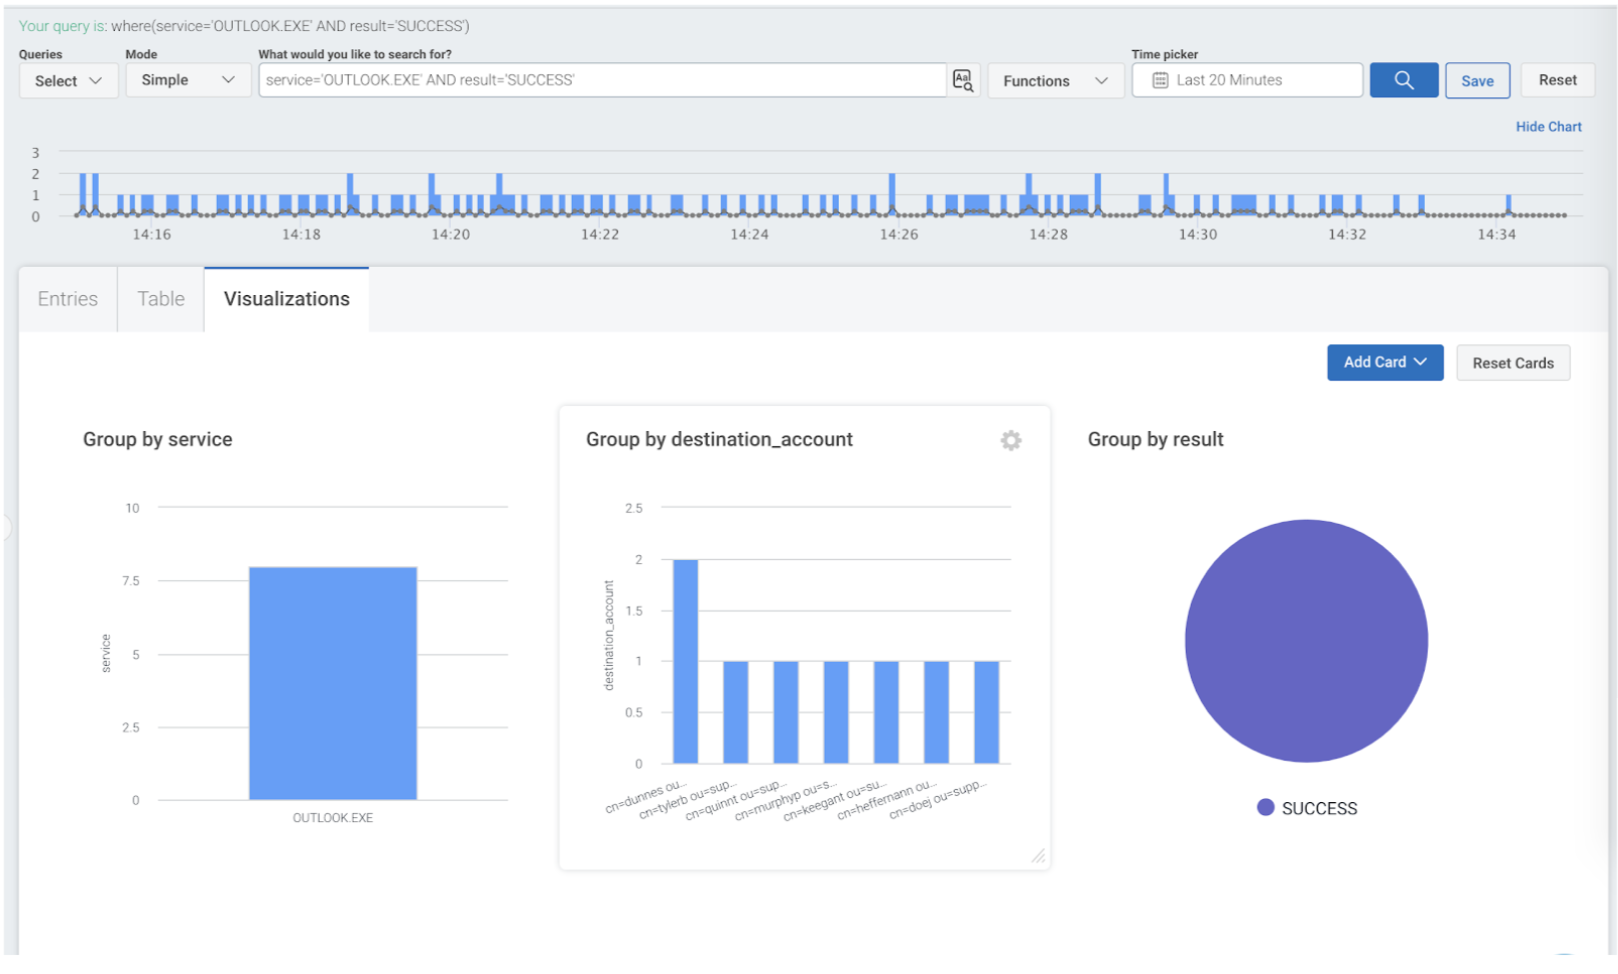
We can continue to drill down further by selecting a “result” slice in the bar chart to only show entries which contain result = “SUCCESS”