Azure DevOps Integration
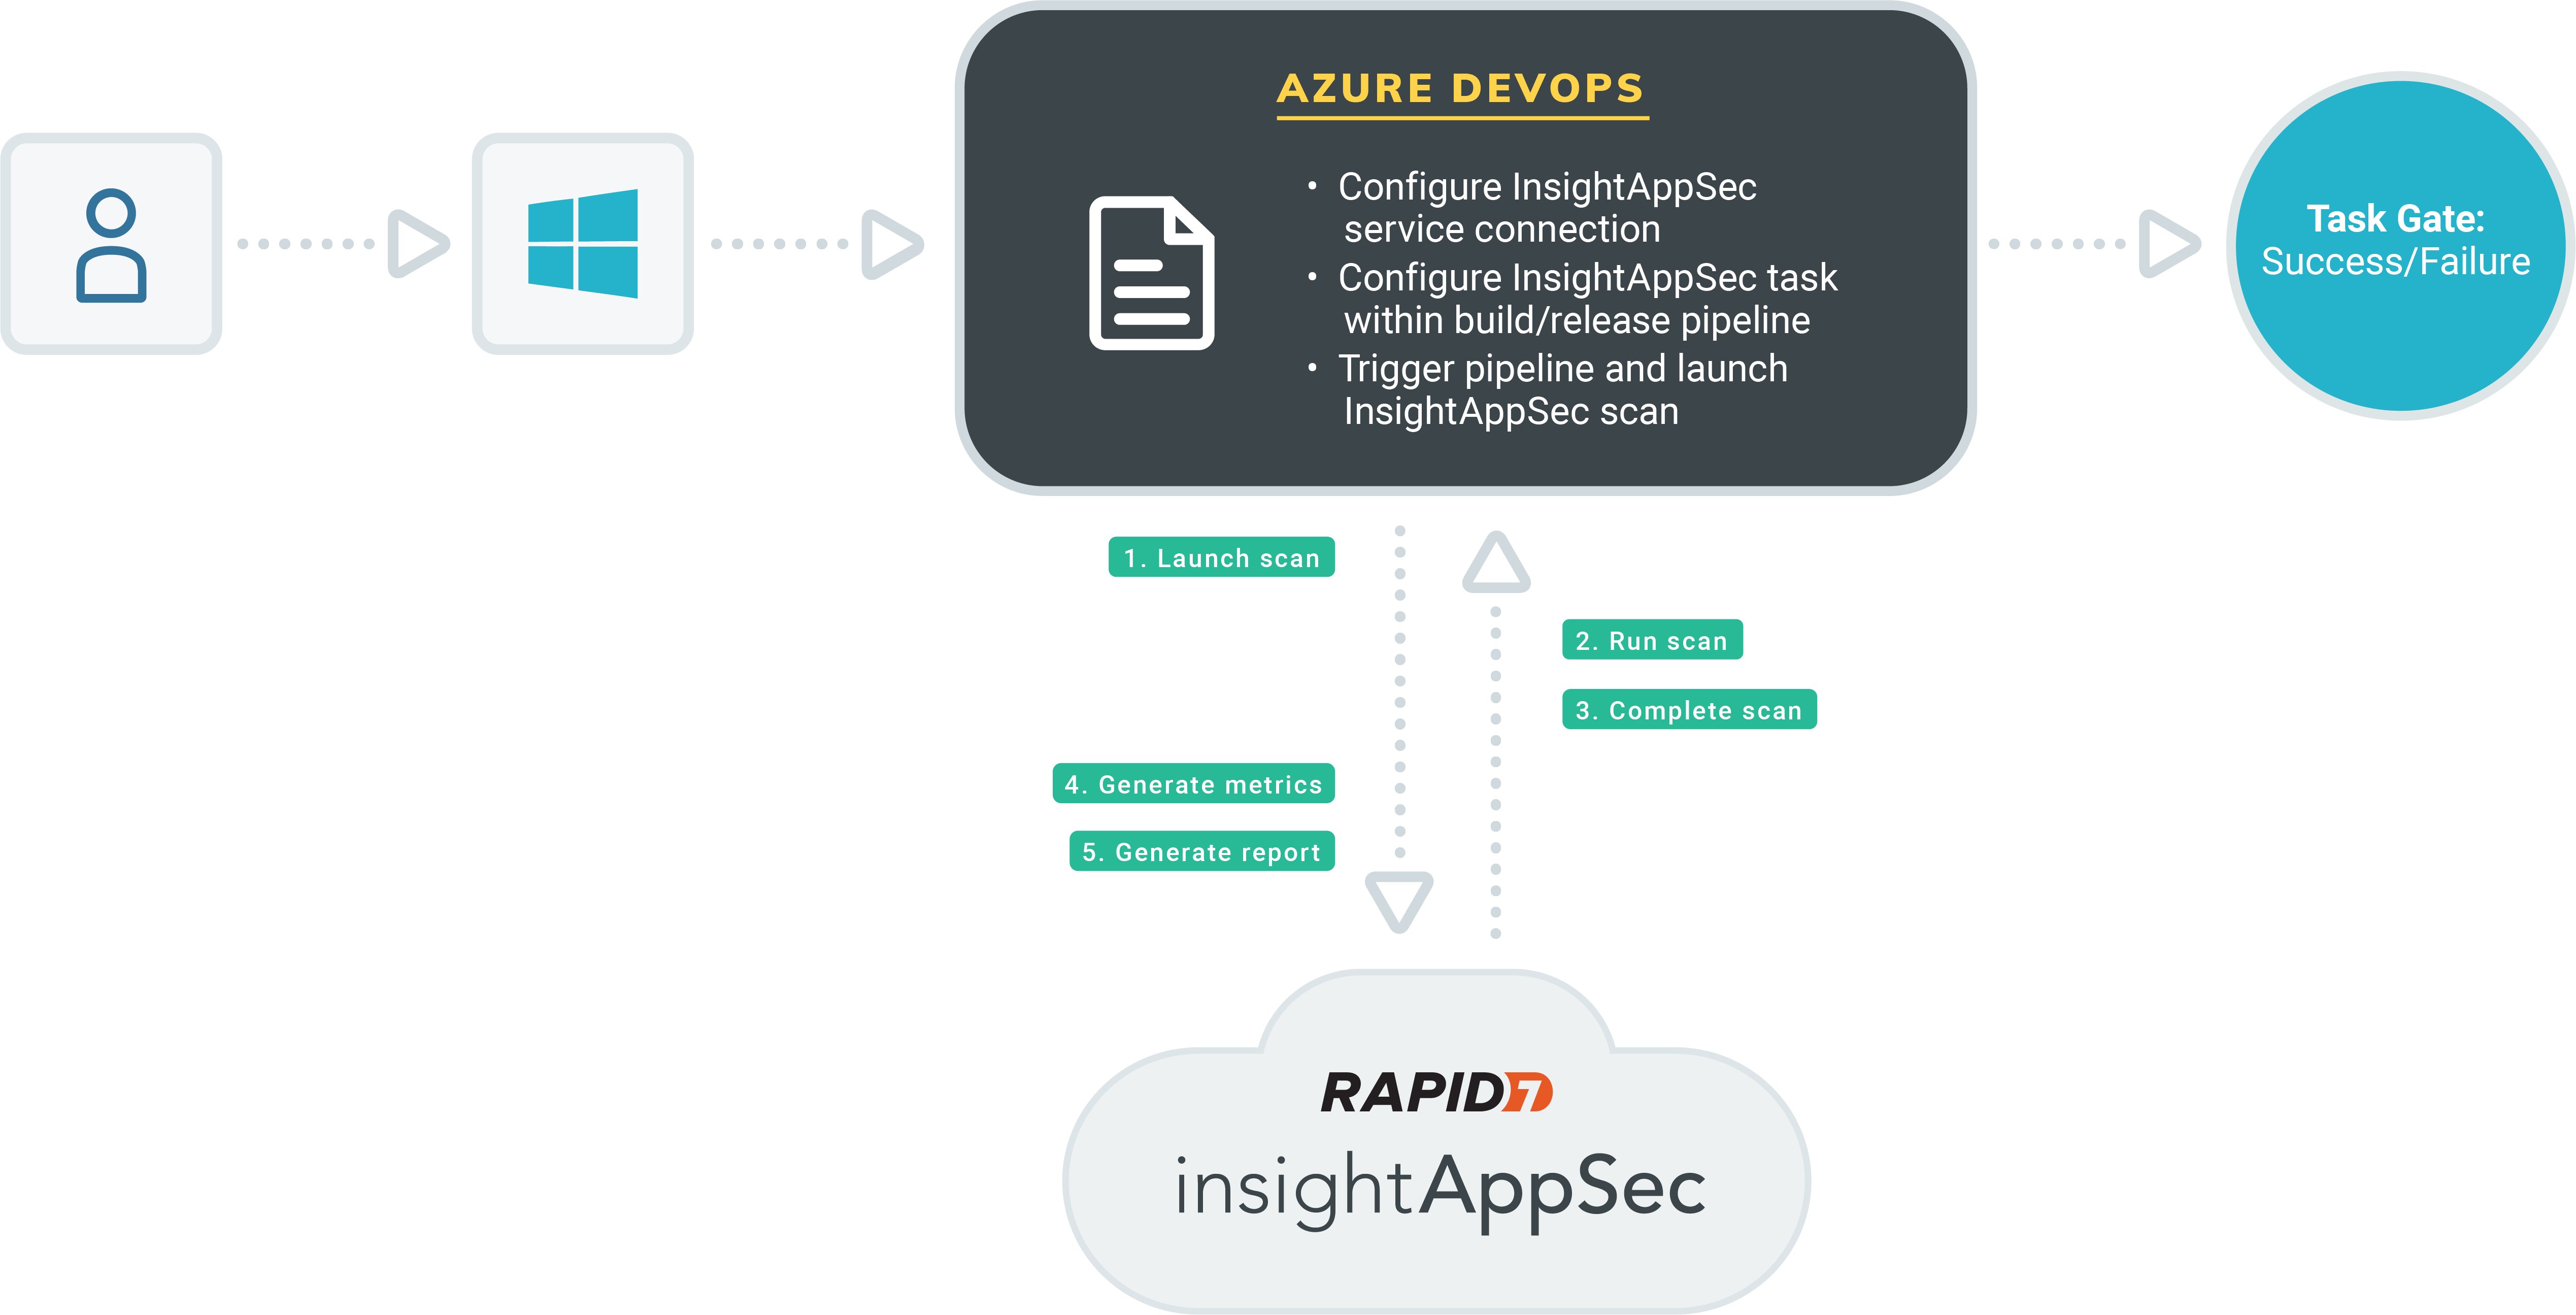
Application Security (InsightAppSec) integrates with Azure DevOps build and release pipelines to empower development teams to autonomously test the integrity of an application at runtime within their own CI/CD workflow. Using the Application Security (InsightAppSec) Azure DevOps extension within an Azure DevOps Pipeline gives security teams essential feedback regarding a web application’s security posture and risk status as part of an integrated CI/CD task and allows development teams to pass/fail and fix fast.
The Application Security (InsightAppSec) Azure DevOps Extension utilizes the Application Security (InsightAppSec) RESTful API to dynamically retrieve applications, launch scans, monitor their progress, and generate reports based upon scan results. This extension can be leveraged as both a Build and Release task within Azure DevOps.
Key Capabilities
The extension is designed with the following capabilities:
- Launch a new Application Security (InsightAppSec) scan during build or release
- Perform scan monitoring
- Provide a metrics report of scan results
- Provide raw scan results
- Enforce scan gating based on vulnerability query filtering
Scan gating provides an automated way to fail tasks as part of a build should scan results meet a defined vulnerability query, stopping certain risk from being promoted into production.
Metrics Report Output
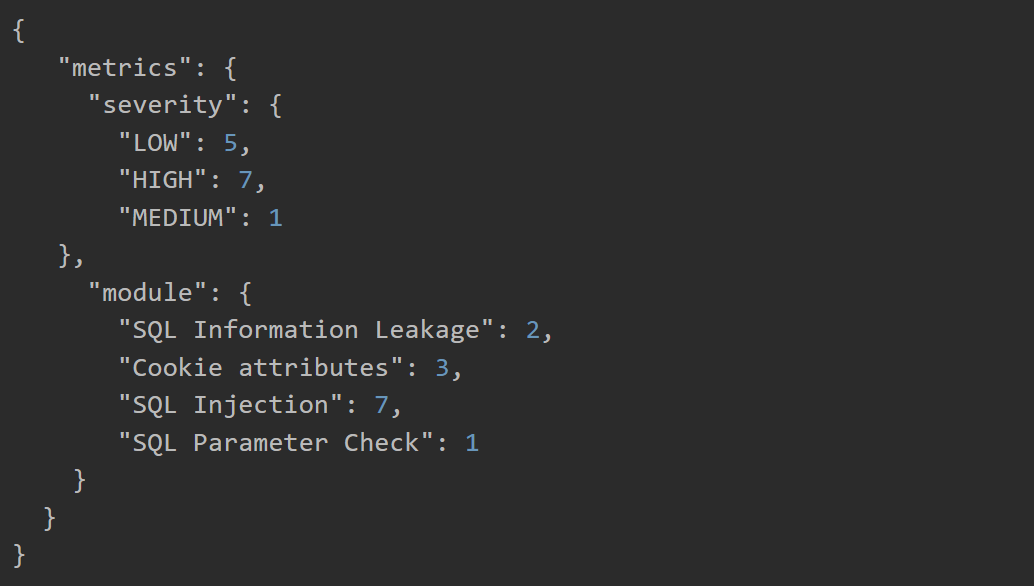
Once the scan within the build or release pipeline has been completed, a report will be generated and written to the current working directory in Azure DevOps. It contains metrics on vulnerability severity and attack modules retrieved from the scan.
Get Started
By integrating Application Security (InsightAppSec) into your CI solution, quality gates can be enforced to proactively secure applications before being released into production. The Application Security (InsightAppSec) Azure DevOps Extension is a way to make security teams smarter while keeping development teams efficient. Visit the Visual Studio Marketplace Listing to get the Application Security (InsightAppSec) Azure DevOps Extension.
Install the Application Security (InsightAppSec) Azure DevOps Extension
Before utilizing the extension as part of a build or release pipeline, it must be installed under the selected organization. To do this:
- Navigate to the Visual Studio Marketplace Listing or locate the extension there by searching for Rapid7 Application Security (InsightAppSec).
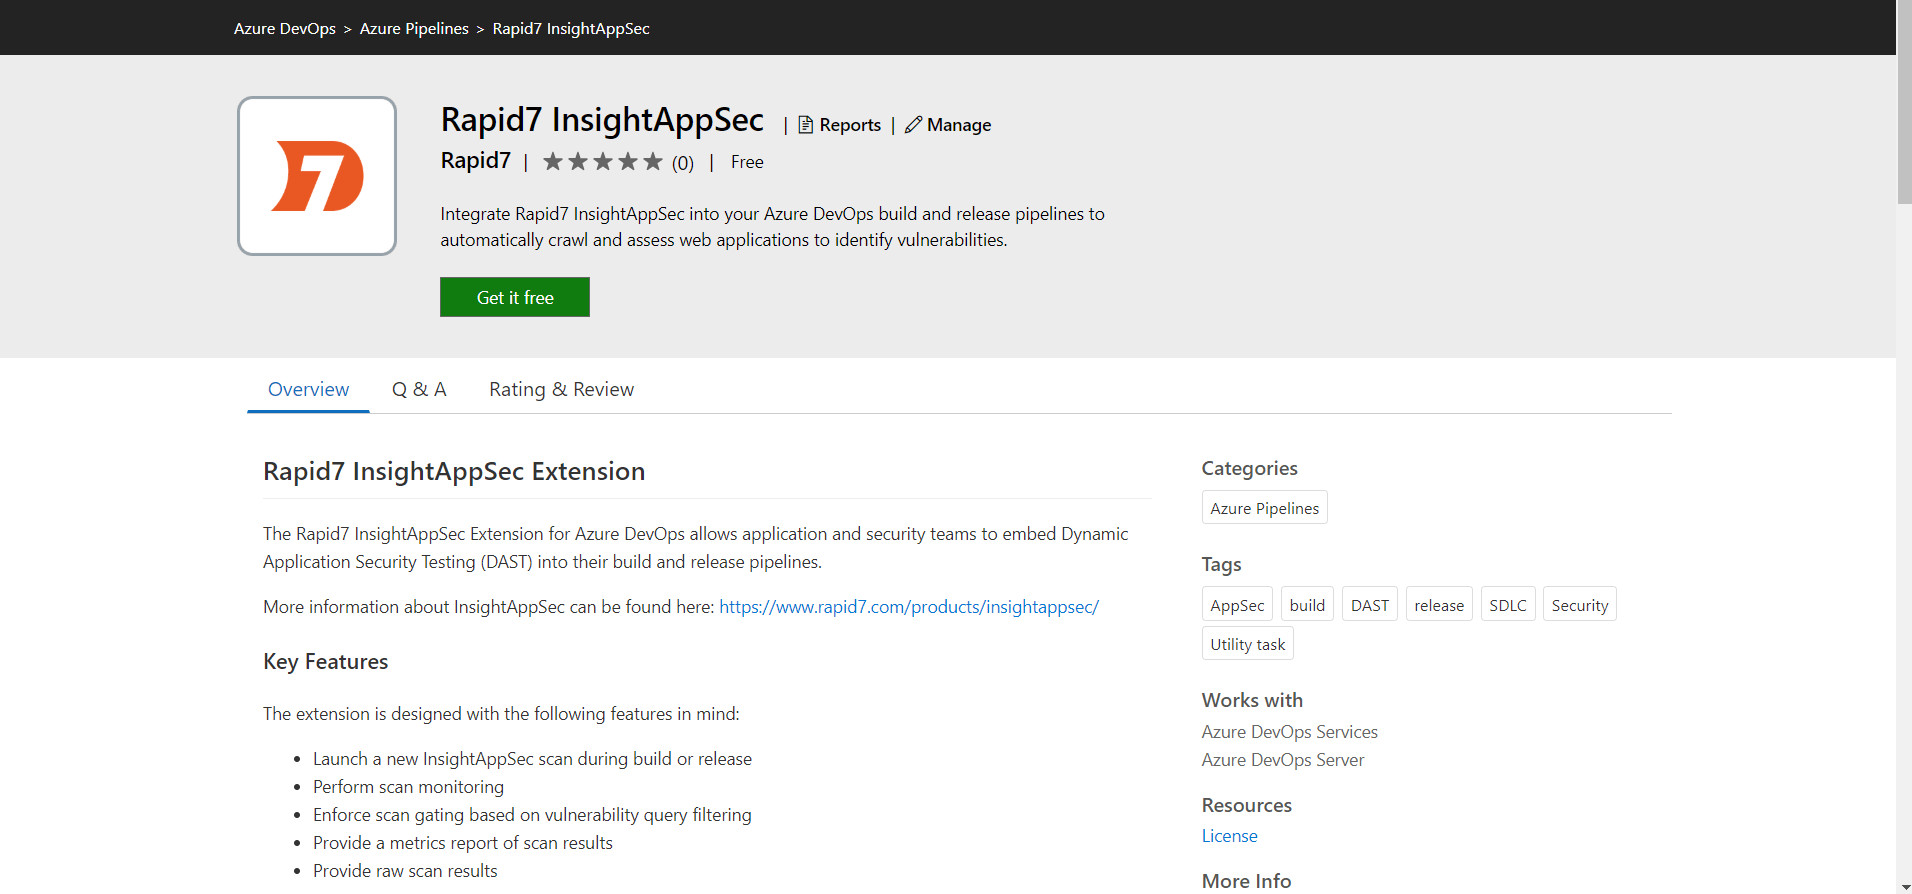
- Click the Get it free button to begin the installation process.
- The next page allows you to select the organization within Azure DevOps where the extension will be installed. There is the potential of utilizing it for multiple organizations, but it must be individually installed under each one.
- Select your organization and click the Install button. A successful installation screen should soon follow, confirming that the extension is now ready for use within your organization.
Create a Service Connection
You must create a Service Connection before configuring the Rapid7 Application Security (InsightAppSec) extension within a pipeline. To do this:
- Go to the homepage of your organization, then select the project whose pipelines will be utilizing the extension.
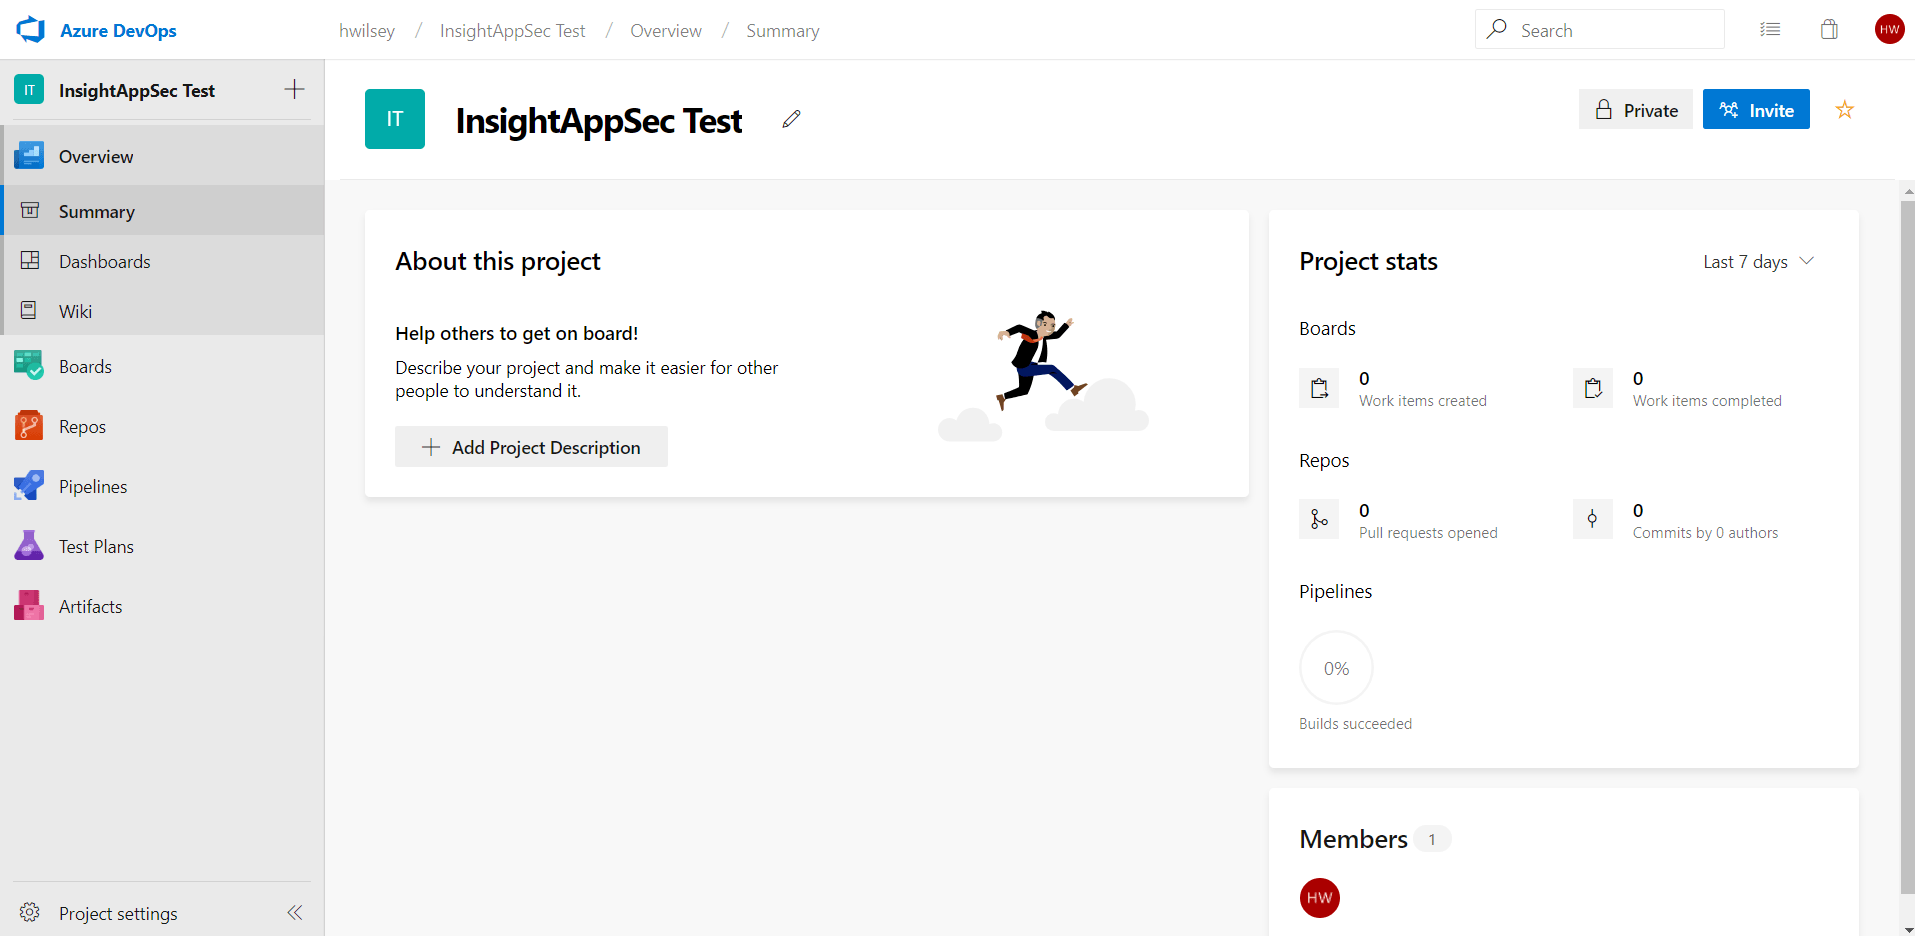
- On the project’s homepage, select the Project Settings option, then click on Service Connections under the Pipelines header.
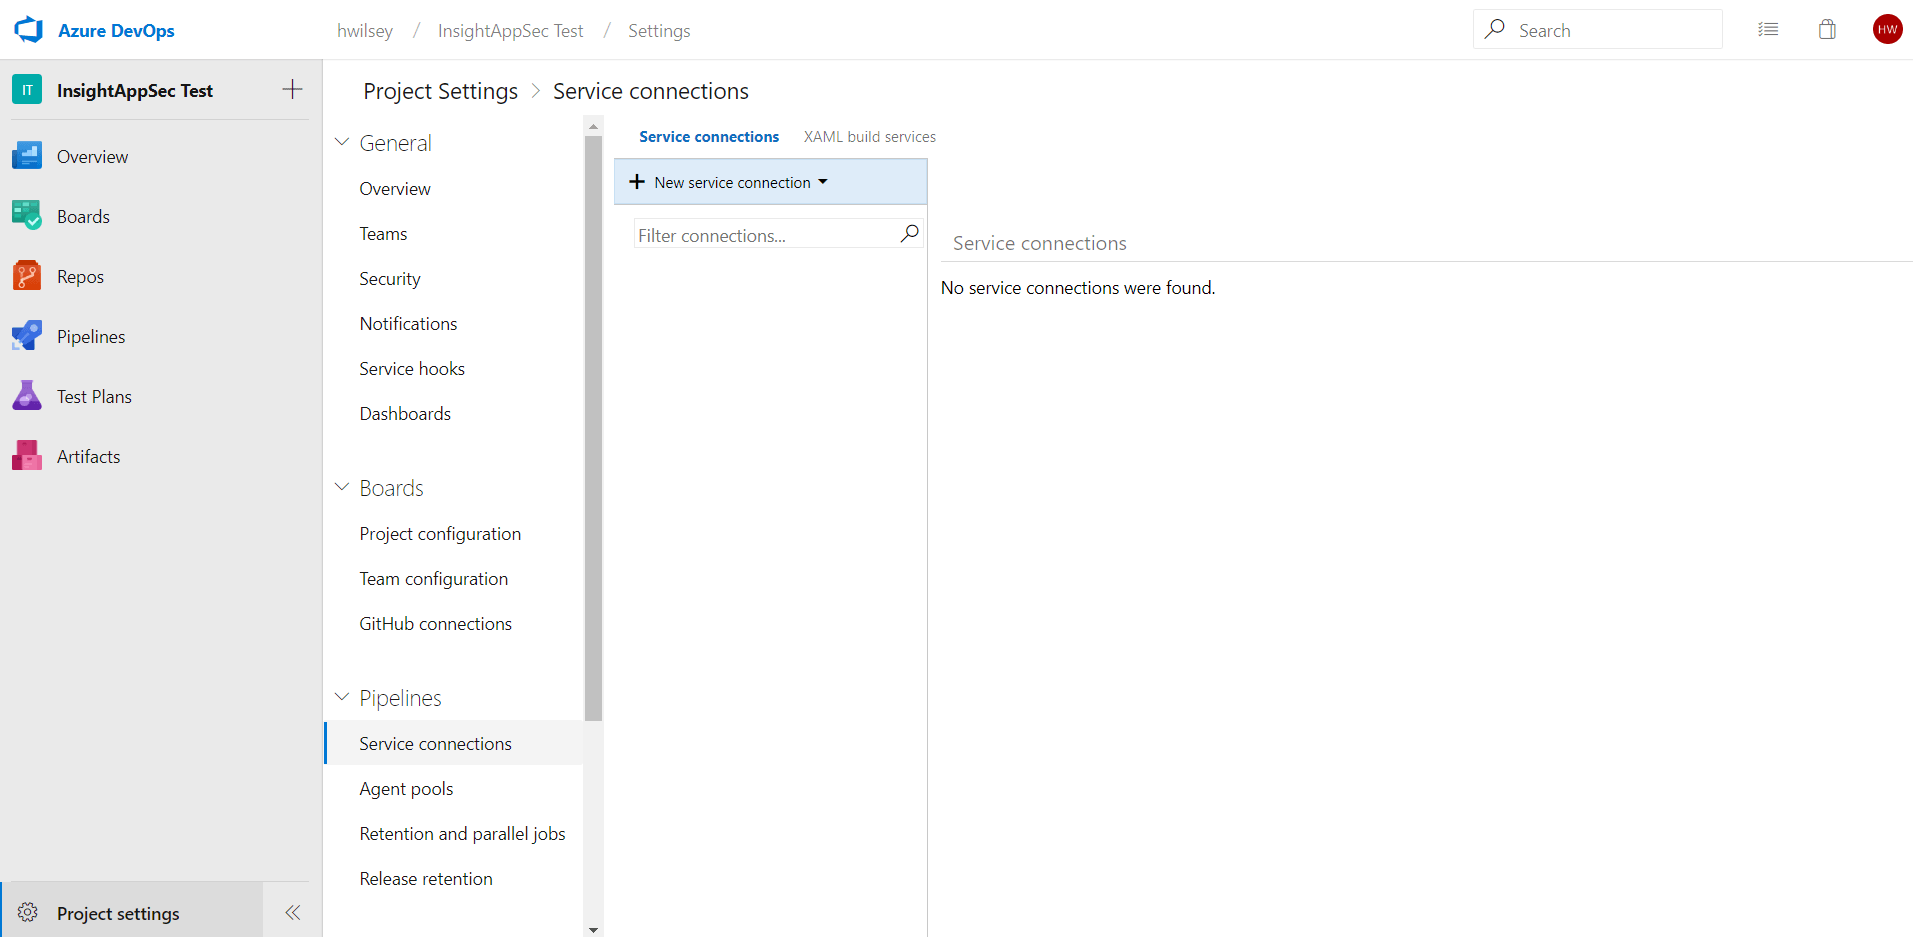
- This extension utilizes the Application Security (InsightAppSec) RESTful API to perform actions, such as retrieving applications and launching scans. To allow for this, we must first configure a connection to this API so all extension functionality can proceed accordingly. Click New service connection to begin with this configuration, then select the Rapid7 Application Security (InsightAppSec) connection type.
- Provide a “Connection name” for this service connection, preferably something specific to note that this is associated with Application Security (InsightAppSec). The Region can be selected from the dropdown, and it refers to your Rapid7 Application Security (InsightAppSec) region. The API Token is a unique key that will also be provided by Rapid7 and serve as an identifier for API authentication.
- Click OK to create the connection. The connection will be listed under “Service Connections”, should you ever need to edit it.
Create a Pipeline with the Application Security (InsightAppSec) Extension
With the service connection configured, the next step is to actually create a build or release pipeline that will utilize the new extension.
On the left menu, hover over Pipelines and navigate to either Builds or Releases, depending on on the type of pipeline you wish to create.
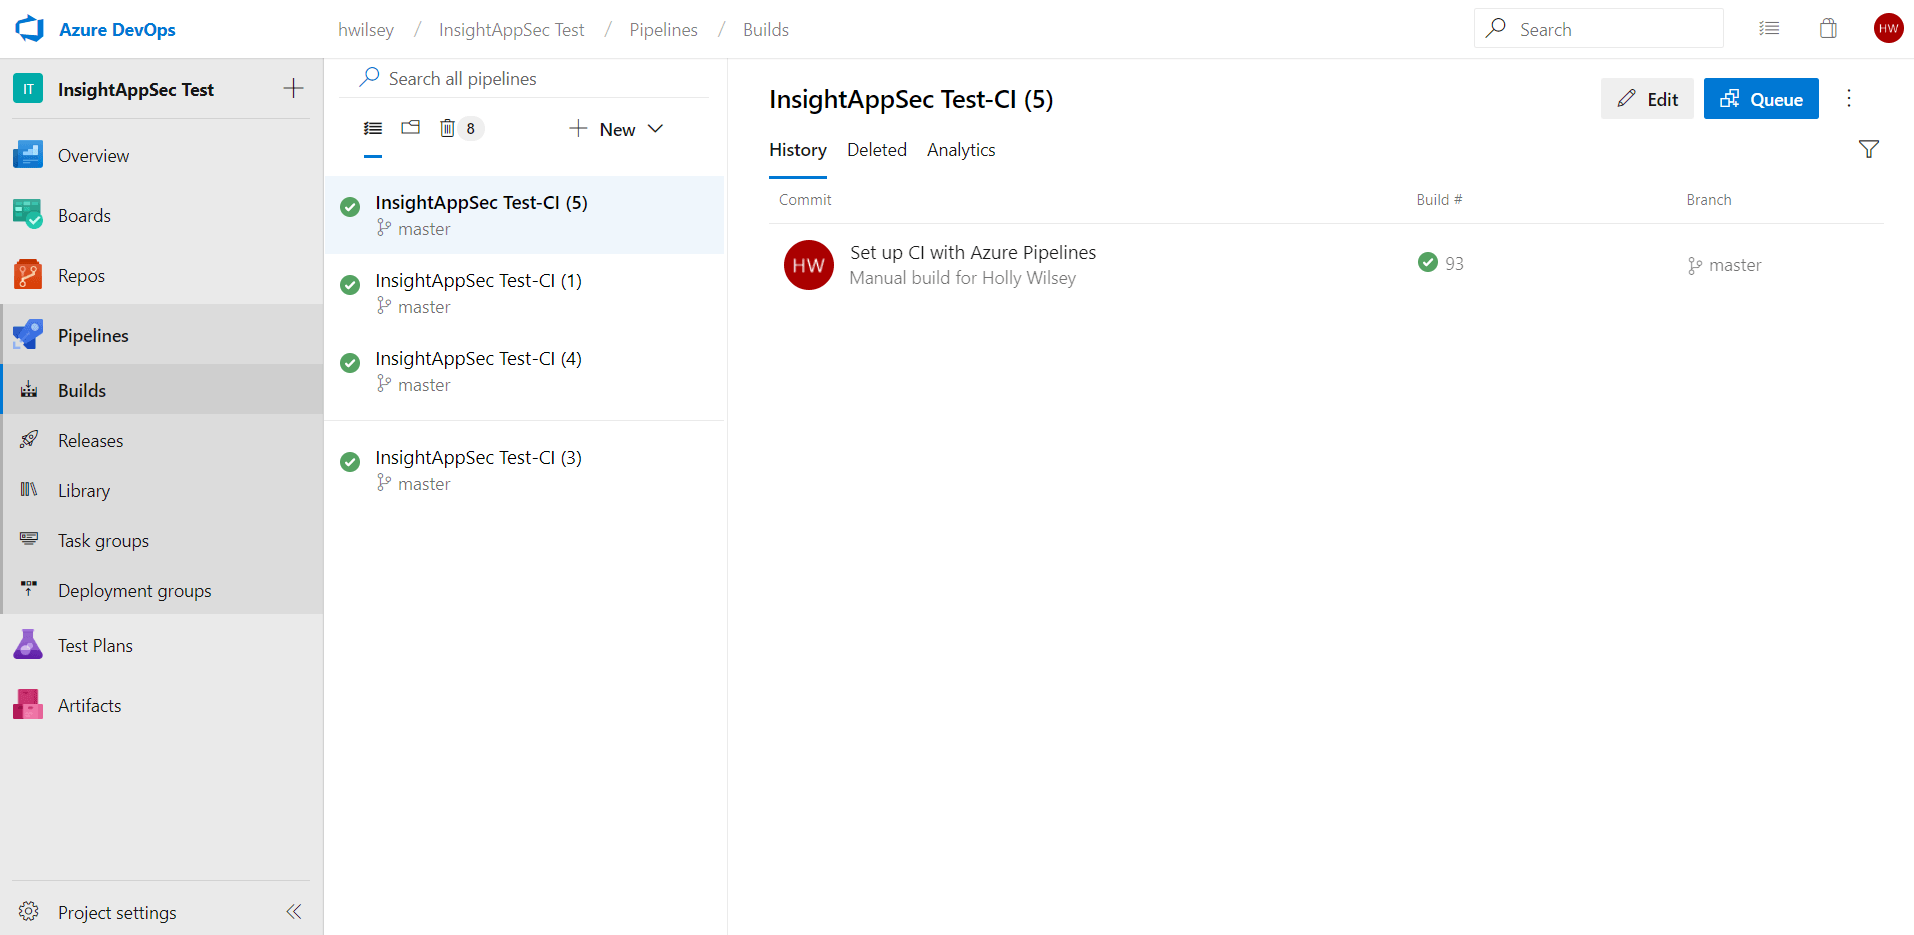
Any existing pipelines, along with their success or failure status, will be listed here. The Application Security (InsightAppSec) extension can be added to a brand new pipeline or within an existing one. This guide will detail adding it to a new pipeline, though the steps for existing pipelines remain largely the same.
- Start by clicking the + New dropdown, and then select New build pipeline.
- The new pipeline wizard will open. You can either select your repository via the provided YAML options, or use the classic editor to do so without YAML. In this example, we’ll proceed with the classic editor.
- This will take you to another page for repository selection. Select the appropriate source, project, and branch options, and click Continue.
- Next is the template selection. If preferred, select from the several existing templates, or otherwise select Empty job at the top to begin from scratch.
- This will start a fresh template to allow for the addition of any number of tasks. Click the + sign on “Agent job 1” to add a task where we can utilize the Rapid7 Application Security (InsightAppSec) extension.
- A full list of tasks will be displayed. Use the search box at the top right and search for “Application Security (InsightAppSec)” to quickly find the Rapid7 extension. You will see both the Marketplace listing, which displays the status of the extension (in this case it should be “Installed”), and the task itself that can be added to a pipeline. Hover over the task and select the Add button to add it as a task for the pipeline.
- You may see a “Some settings need attention” warning associated with the task due to the fact that it has some fields that are required. The pipeline will not save if these fields are not addressed. Click on the newly added task to view all of its fields.
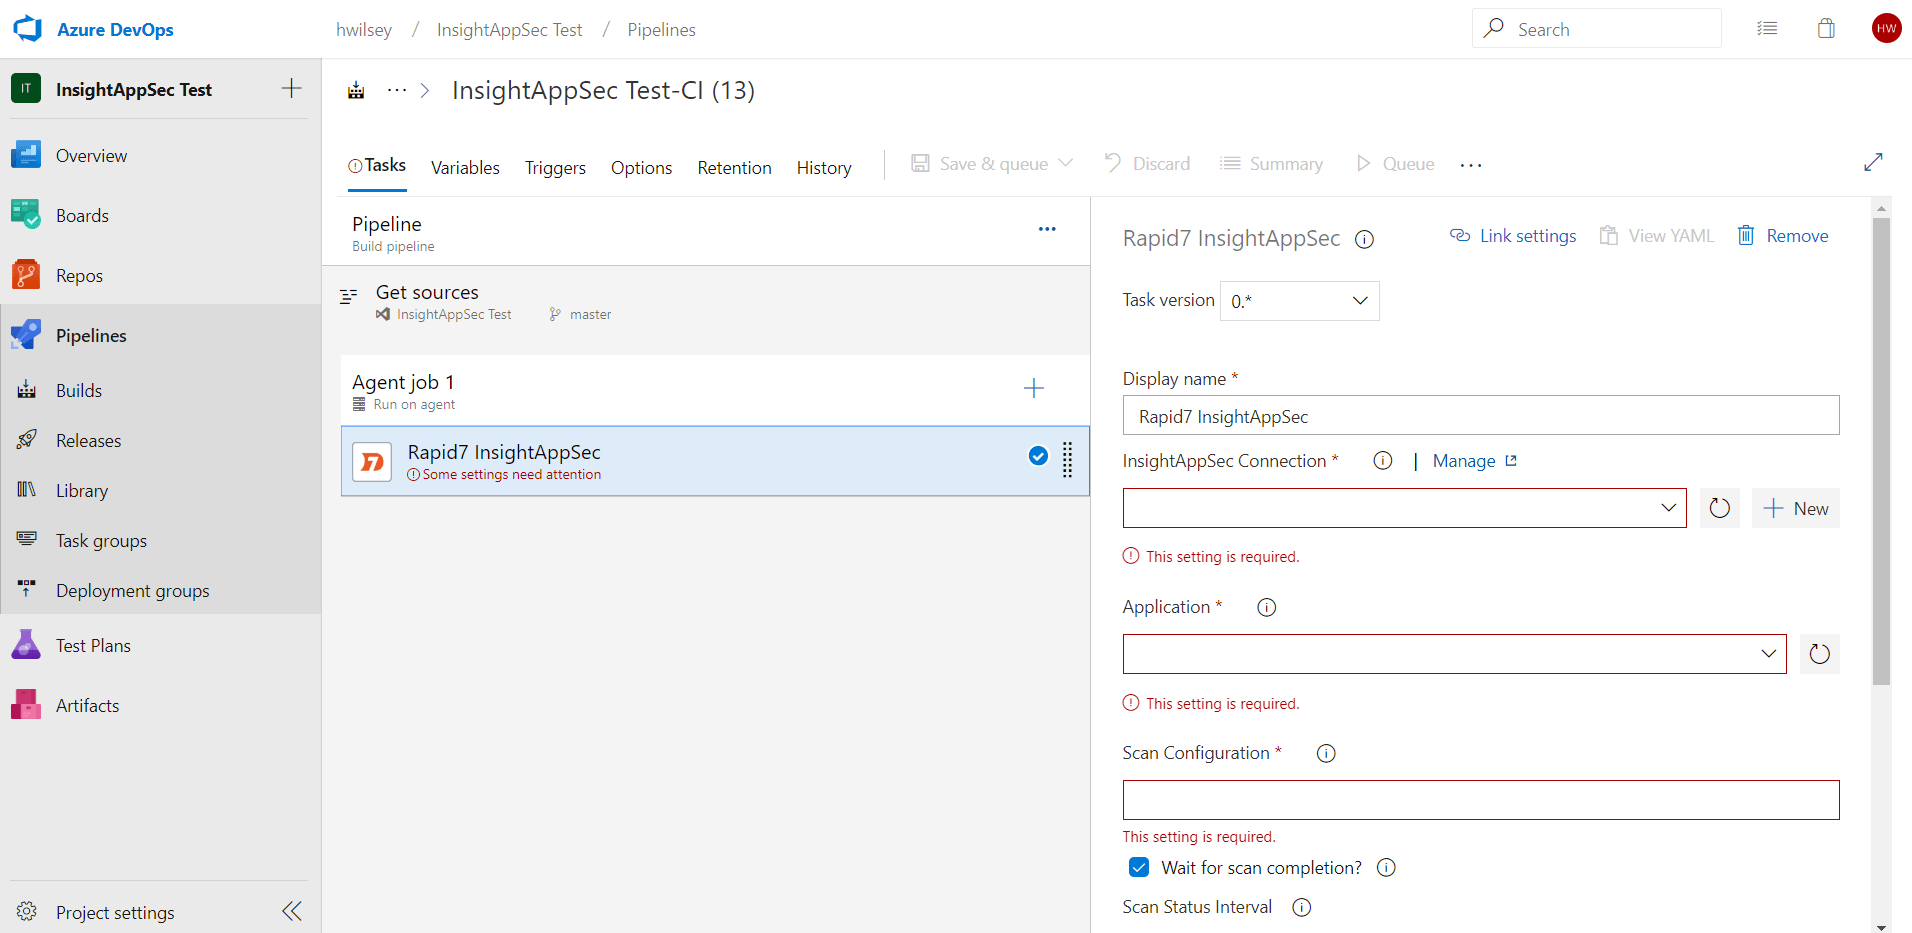
This is the initial view of the task and its settings. These settings will allow for configuration of the task, its connection to Application Security (InsightAppSec), and its scanning. Here is a list of all the settings in greater detail:
- Display name - The name of the task as it will appear in the pipeline.
- IAS Connection - A service connection that allows for connection and authentication to the Application Security (InsightAppSec) API. Drop-down menu containing the connection that was shown configured in a previous step.
- Application - A drop-down menu to select the Application Security (InsightAppSec) application that will be scanned.
- Scan Configuration - A text field to input the Application Security (InsightAppSec) scan configuration that will be utilized in the scan.
- Wait for scan completion? - Option used to determine whether the pipeline will continue to the next step after launching the scan, or whether it will wait for its completion.
- Scan Status Interval - The frequency (in minutes) that the scan’s status will be checked upon and logged. Dependent on “Wait for scan completion” being checked.
- Generate findings report? - Option used to generate a raw JSON report that contains all findings from a completed scan.
- Fail scan on timeout? - Option used to determine whether the scan will be cancelled and marked as failed if it reaches the timeout limit. Dependent on “Wait for scan completion” being checked.
- Timeout - The timeout for the scan completion (in minutes). Dependent on “Fail scan on timeout” being checked.
- Scan Gating - Option used to determine whether the build will fail if the provided query returns results.
- Vulnerability Query - The query executed against the completed scan’s findings to retrieve any matching vulnerabilities. Dependent on the option “Scan Gating” being checked.
- Upload report output? - Uploads any generated reports to build pipeline artifacts or release pipeline logs.
- Upload artifact per report? - For build pipelines only - when uploading reports to pipeline artifacts, one artifact is created per report rather than having both grouped within one artifact. Dependent on “Generate findings report?” and “Upload Report Output”.
Below is a full example configuration of the settings within the task. Note the usage of the “Wait for scan completion” option and its dependent fields, as well as the usage of Scan Gating. In this case, that query will result in the build failing, should the scan return any vulnerabilities whose severity is HIGH.
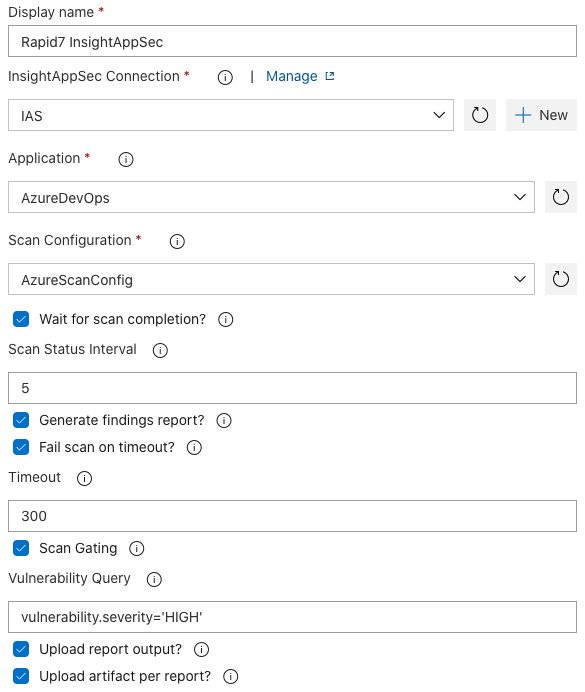
Once you have configured the settings for the Rapid7 Application Security (InsightAppSec) task, as well as completed any additional tasks you want in the pipeline, select one of the two Save options to ensure the pipeline is saved for future use. “Save” will simply save the pipeline’s current state, while “Save & queue” will immediately launch the pipeline and begin with the execution of each configured task.
Output
Once the scan within the pipeline has completed, a report will be generated. If the Upload report output? option is checked, it will be written to pipeline artifacts for build pipelines, or to the logs for release pipelines. It contains metrics on vulnerability severity and attack modules retrieved from the scan.
Note that the “Wait for scan completion” option must be checked in order to retrieve the report in this manner, because it is comprised of the results that are generated upon scan completion.
Reports for build pipelines are accessible from the results page of the build, under “Related” in the Summary section. You can download these reports as needed for any additional usage.
For release pipelines, in the “Logs” tab of the release stage there is an option to Download all logs. This option will download a ZIP file of all logs for the release. Extract and click through all folders until you reach the folder containing 2_Rapid7_Report_Output.zip (note that the leading number in the name of the ZIP file may change depending on the number of tasks in the release). Extract this ZIP file to retrieve the reports.
Troubleshooting
The extension doesn’t appear when I search for it while creating a pipeline
The extension must first be installed under your organization in order for it to be available for usage in a pipeline. Go to the Azure DevOps homepage (https://dev.azure.com/organizationName ) and click on Organization Settings, then select Extensions. Check to see if the extension is listed under the Installed tab. If not, then you can find it under its Visual Studio Marketplace Listing.
The pipeline failed and I’m not sure why
There are logs available within the Rapid7 Application Security (InsightAppSec) step of the pipeline that can tell you why the pipeline may have failed. Go into Pipelines under Builds or Releases, then select the build that failed. You can click the Rapid7 Application Security (InsightAppSec) step here to view all of the logs and any error messages that may have resulted in pipeline failure.
There are API errors occurring in the logs when running the pipeline
API errors are most likely due to an issue with the connection that was setup to be used with this extension. In the Rapid7 Application Security (InsightAppSec) Connection that you created, double check the URL and the API key fields that were entered. The URL should be formatted as follows: https://us.api.insight.rapid7.com/ias/v1
With the “us” value being the only thing that would potentially differ. This value is dependent on your region. A full list of supported region codes is documented here: https://insight.help.rapid7.com/docs/product-apis#supported-regions
I didn’t get any reports saved in Azure DevOps after my scan completed
This could occur for a couple reasons: The “Wait for scan completion” option wasn’t checked. This must be checked in order for reports to be generated. The scan was considered a “failed scan” for any number of reasons, and reports are not generated for a failed scan. Check the logs for the Application Security (InsightAppSec) task to find out why the scan failed. The pipeline is missing the Publish Pipeline Artifact step(s) required for saving those reports as artifacts. Though the reports are always generated for a successful scan, they are not saved as artifacts without the usage of Publish Pipeline Artifact. Refer to the extension’s configuration guide to see an example of this extra artifact step.
The scan portion of the pipeline isn’t logging enough
You can control the frequency of logging a scan’s status with the “Scan Status Interval” field. Inputting a 5 in this field will result in logging the scan’s current status every 5 minutes, for instance. The lower the number, the more frequent the logs. Other errors that occur during the scan will always be immediately logged, regardless of this number.
The scan gating didn’t seem to work and my build was successful
Double check the query that was input in the Vulnerability Query field. This requires a specific type of formatting that could result in the query not returning any results if not adhered to. Here’s an example of scan gating based on severity. Note the single quotes used.
vulnerability.severity='LOW'
Additional query options can be found in the Application Security (InsightAppSec) API documentation. Only filters for the Vulnerability Resource Type should be leveraged.
The pipeline immediately went to the next step upon launching the scan, without giving any scan status updates
To receive logging with scan status updates, you must check the “Wait for scan completion box?” and provide a “Scan Status Interval” during configuration. Otherwise the pipeline will proceed to the next task immediately after launching the scan in Application Security (InsightAppSec).
Immediately moving on to the next task can be helpful in environments where no gating or feedback to Azure DevOps is necessary and teams only want to trigger scans when new changes are made available.
The logs say that my scan timed out
Failing the scan on timeout is an option included in the extension. If it timed out, then the scan is taking longer than expected to complete based on this configuration. You can either uncheck the “Fail scan on timeout?” option, or increase the “Timeout” number. It may also be worth double-checking whether the scan was in a state of PENDING for a long time, since this could indicate some amount of time was lost due to issues with engine availability.
There’s an error that mentions an invalid application or scan configuration
This is most likely an issue with the value input for the Scan Configuration during setup. This field is not a dropdown option, but rather is a plain text input field. This means that there’s the potential for mistakes or typos in this field. It’s also possible that the scan configuration and/or application were deleted since the last time the task was configured.
Support
Need help? We’ve got you covered. Sign into the Customer Portal for our top recommended help articles, and to connect with our awesome Support Team.
Create and manage your cases with ease and get routed to the right product specialist. CUSTOMER PORTAL SIGN IN Introducing the Scheduler: Customers can now schedule time with a support engineer, directly in the Customer Portal. Learn how .