Scan Status
After you start a scan, a Scan Status tab for active scan opens. The default tab is Status.
The left panel is collapsible with the Rewind button.
You may stop and pause the scan while it is running.
When the scan is in the Completed state, you may generate a report and “Open HTML Report.
The Generate report button starts regenerating the report from the database. A “Loading” bar is displayed during the generation process.
Summary
The default selection for the Status page is the scan summary information.
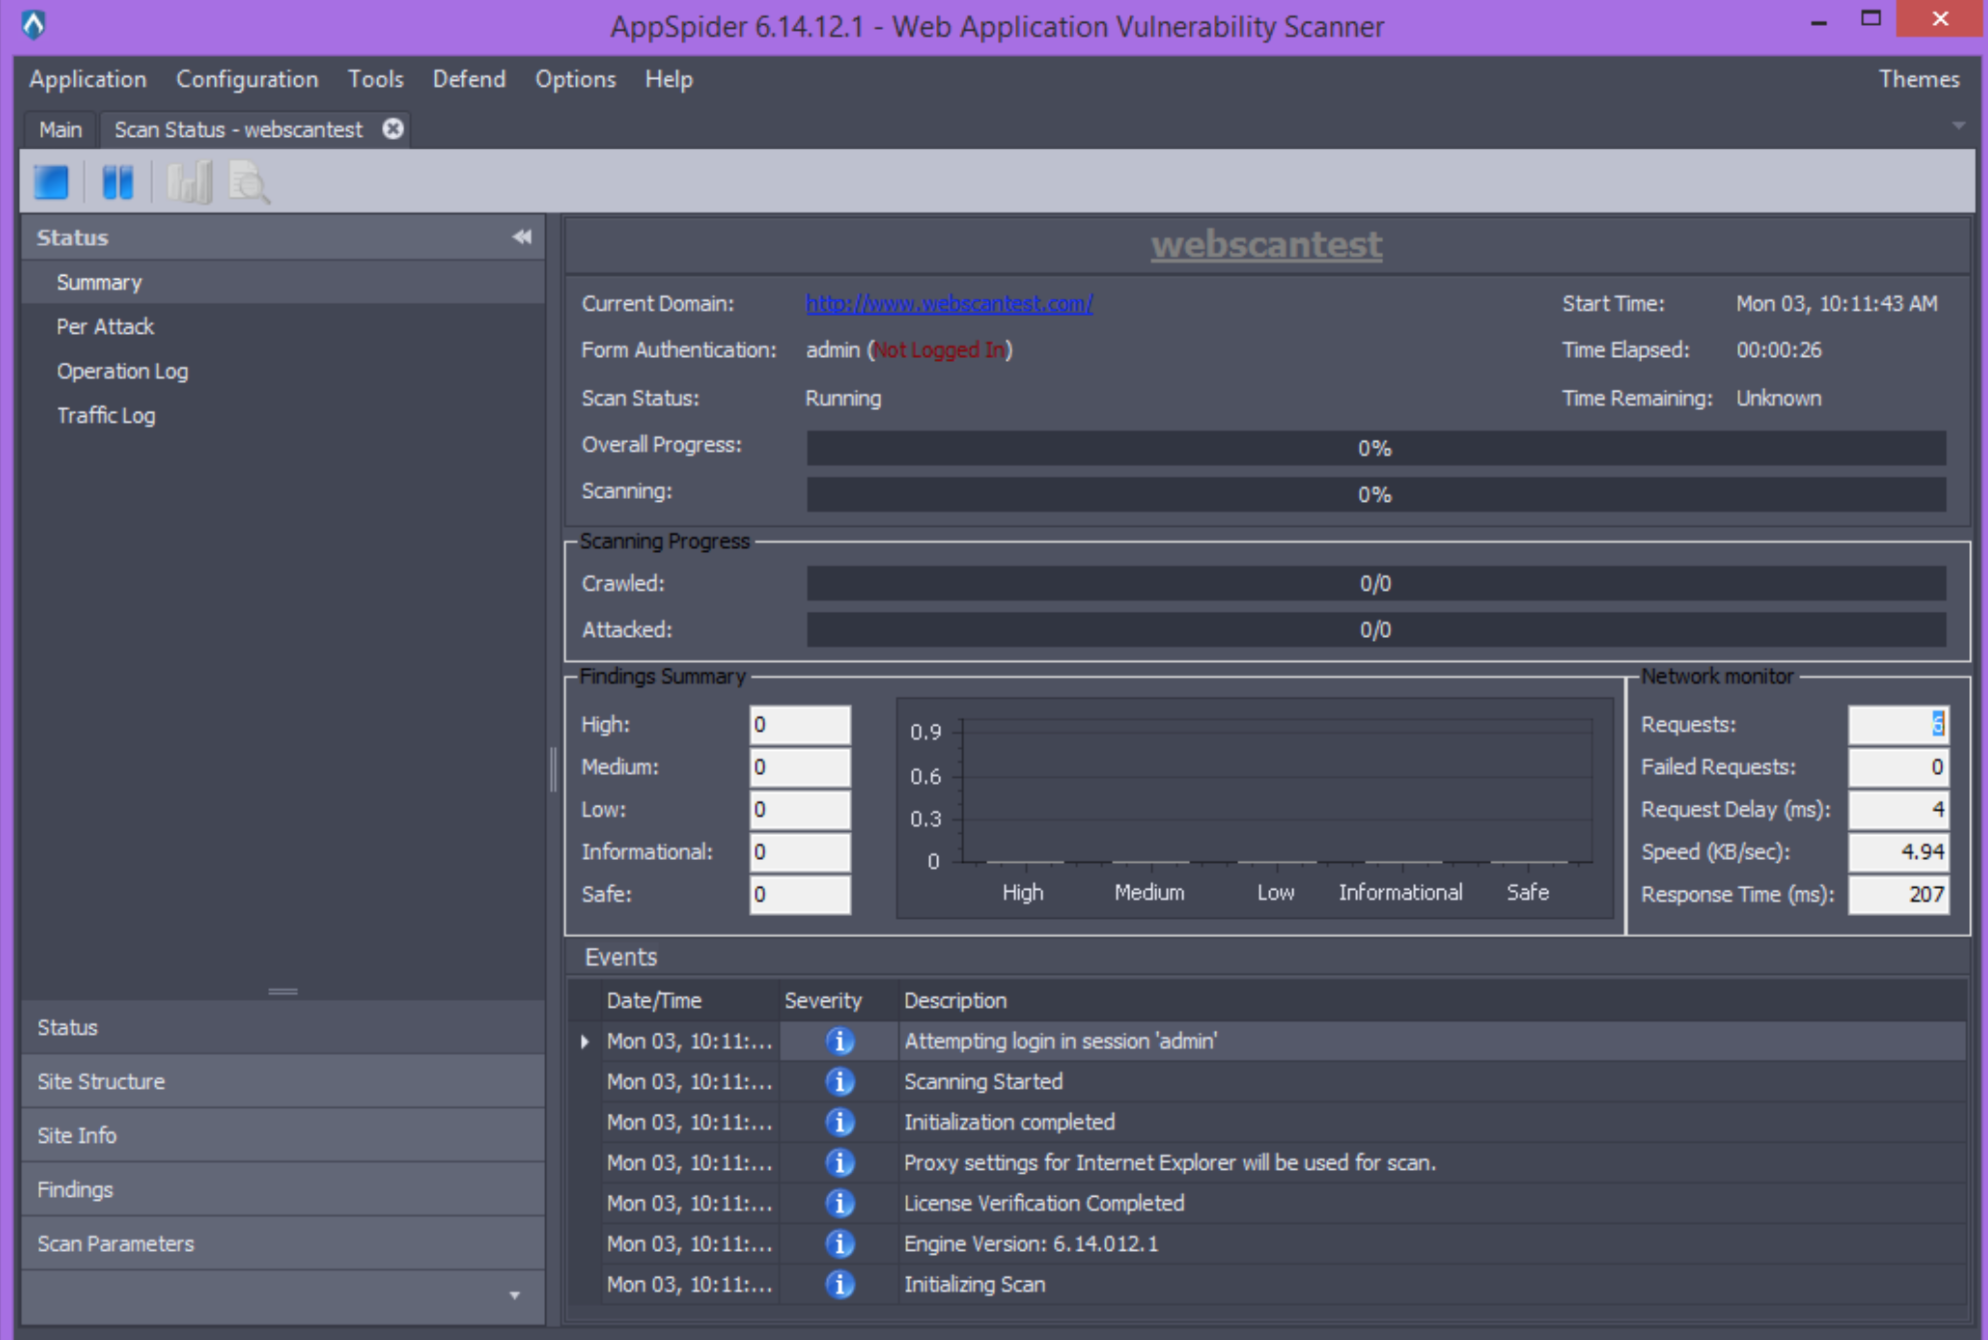
You may find the following information in the panel:
- Name of the scan
- Scan Information:
- Current domain
- Session/Form Authentication
- Scan status (Running, Paused, Completed, Stopped)
- Start Time: Time and Date
- Time Elapsed
- Time Remaining
- Progress bars with scan progress as a percentage:
- Overall progress
- Scan Stage (Initialization, Scanning, Report generation)
- Scanning progress bars with counters:
- Crawled (number of crawled links to number of queued links waiting to be crawled)
- Attacked (number of attacks performed to number of queued attacks)
- Findings summary. Number of vulnerabilities: High, Medium, Low, Information, Safe.
- Network monitor:
- Requests
- Failed Requests
- Request Delay (ms)
- Speed (KB/s)
- Response Time (ms)
- The events table is a list of events with date/time, severity icon and a description of the event.
Per Attack
This panel allows you to observe the list of attacks.
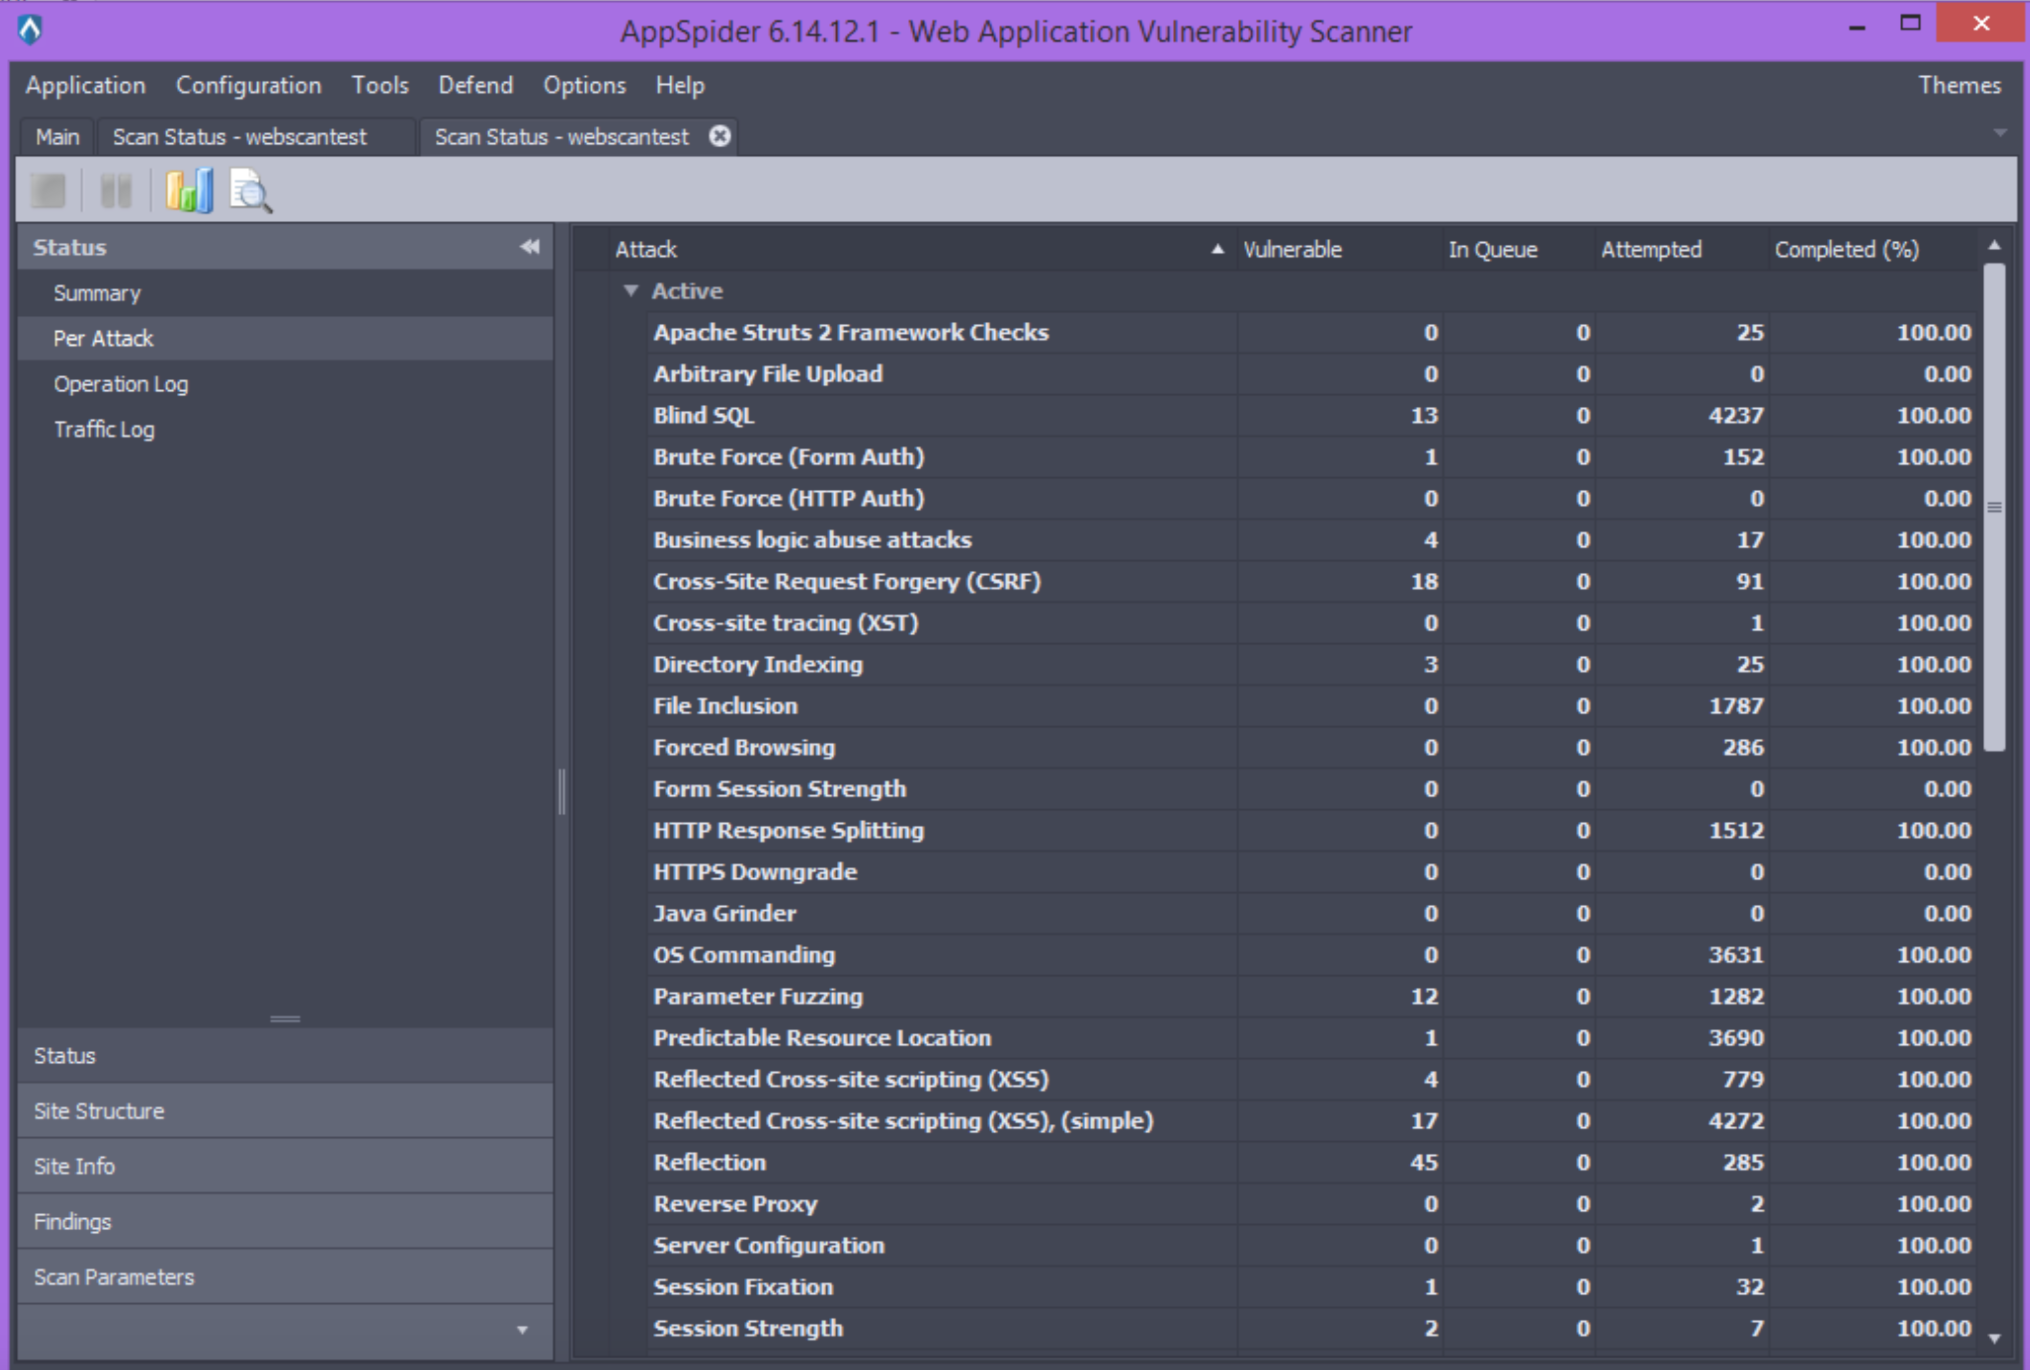
The table has two parts: Active and Passive attacks. You may collapse any part of the table. The following columns are presented:
- Attack: the name of the attack
- Vulnerable: the number of vulnerabilities found
- In Queue: the number of attacks of the current type in the queue waiting to be performed
- Attempted: the number of attacks attempted
- Completed(%): the percent of attacks completed out of the total
Operation Log
This panel allows you to find the list of actions performed by AppSpider (e.g. Initializing the scan, Crawling, Performing an attack, Generating the report, etc.)
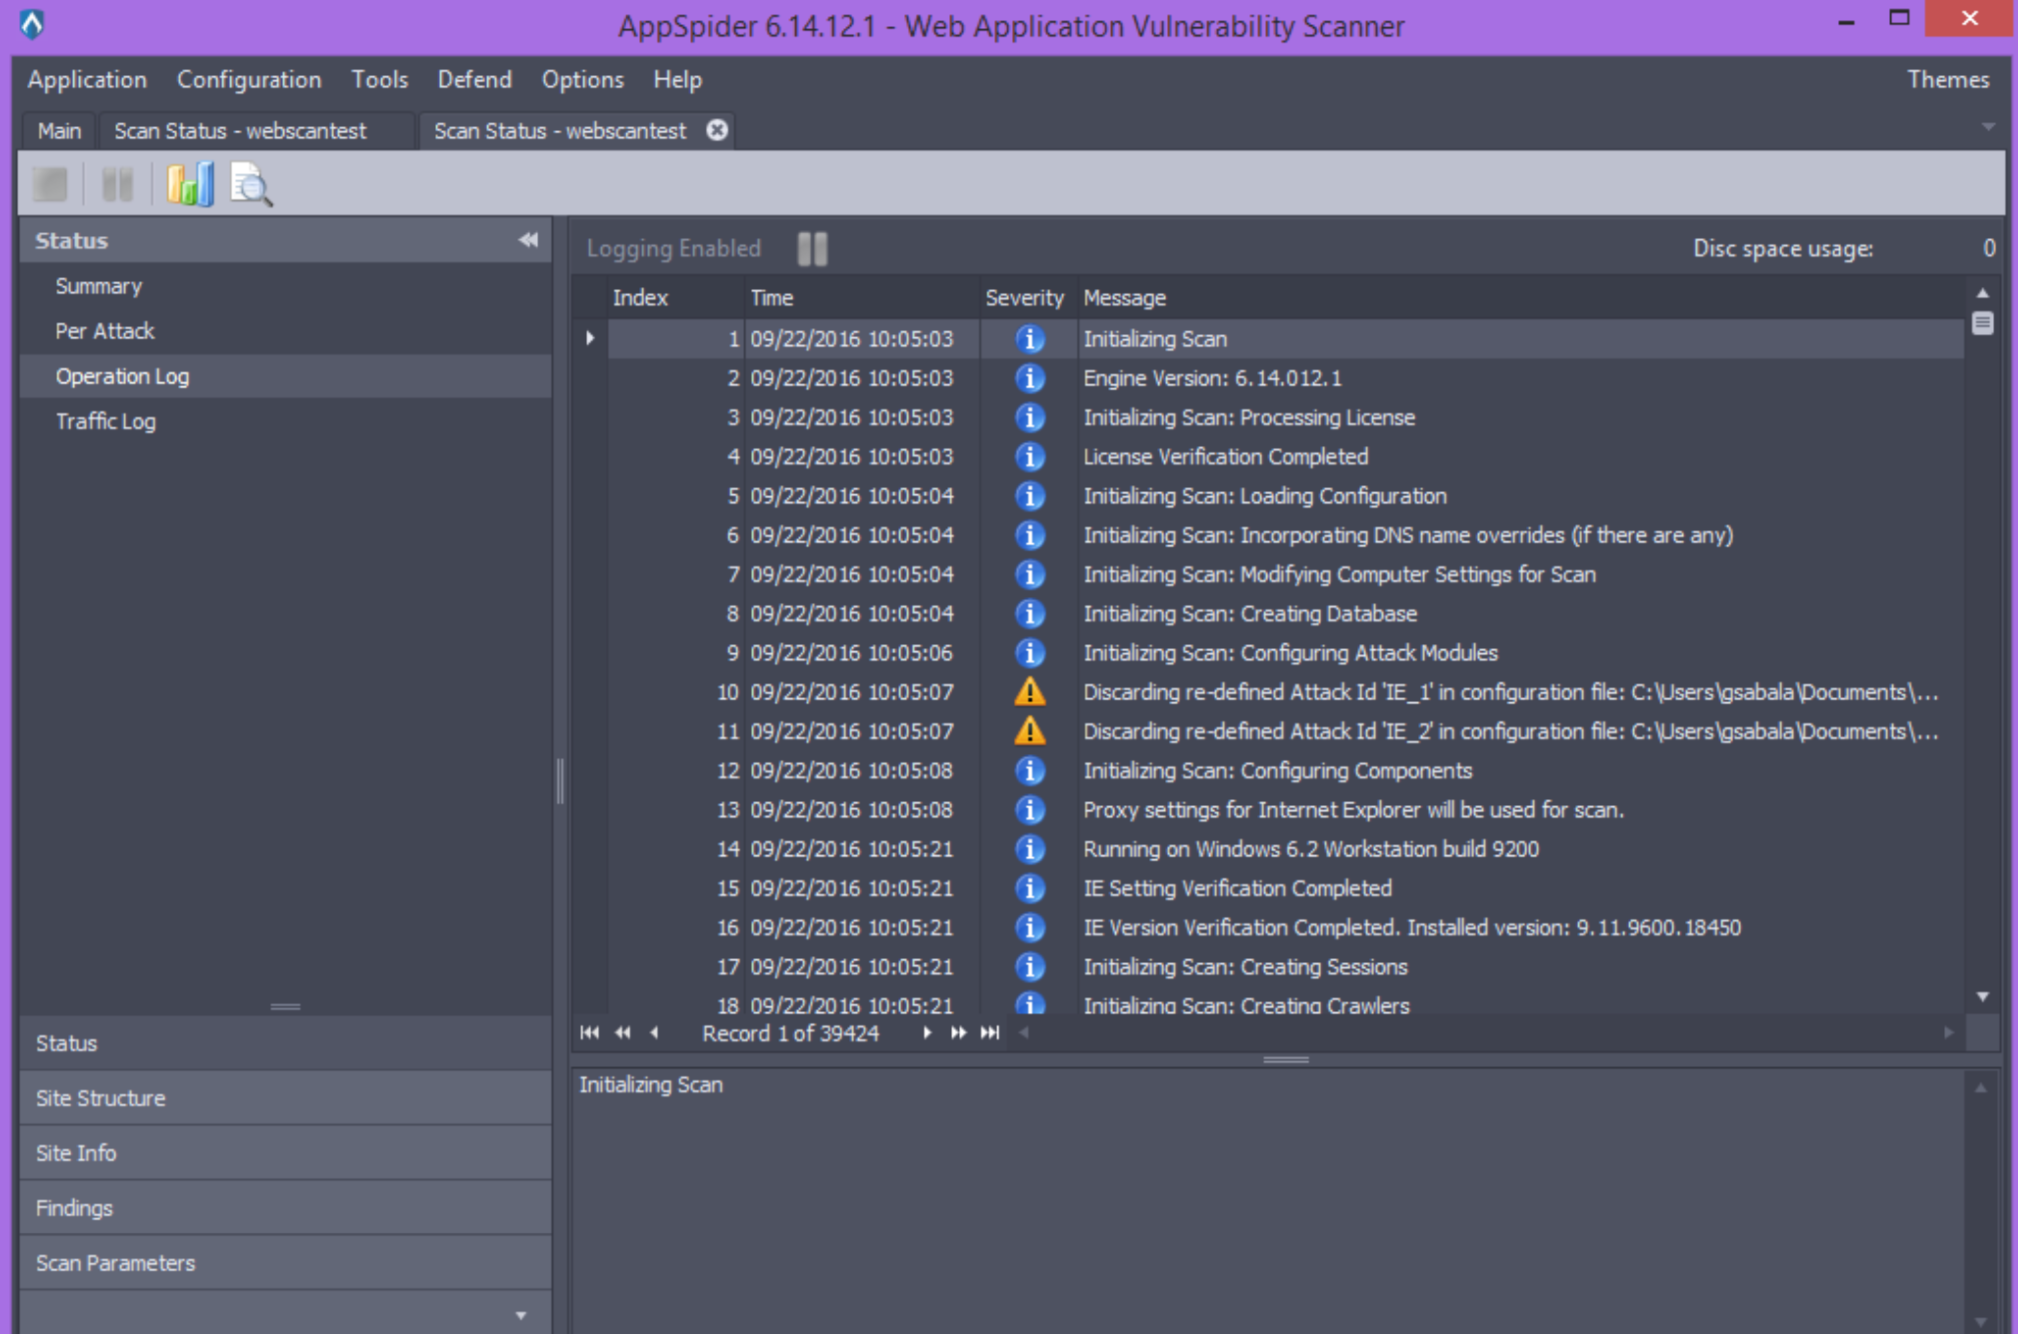
The Logging enabled button is displayed only when the scan is running:
- Pause: pauses logging
- Start: resumes logging
Disc space usage is presented on the screen.
The table contains the following columns:
- Index: the number of the log entries
- Time: the time of the log entries
- Severity: the icon indicating the severity
- Message: event message
Selecting any row will display a message in the text box under the log table. The text box is locked and you will be unable to edit the message.
Traffic Log
This panel allows the user to find the list of requests performed by AppSpider.
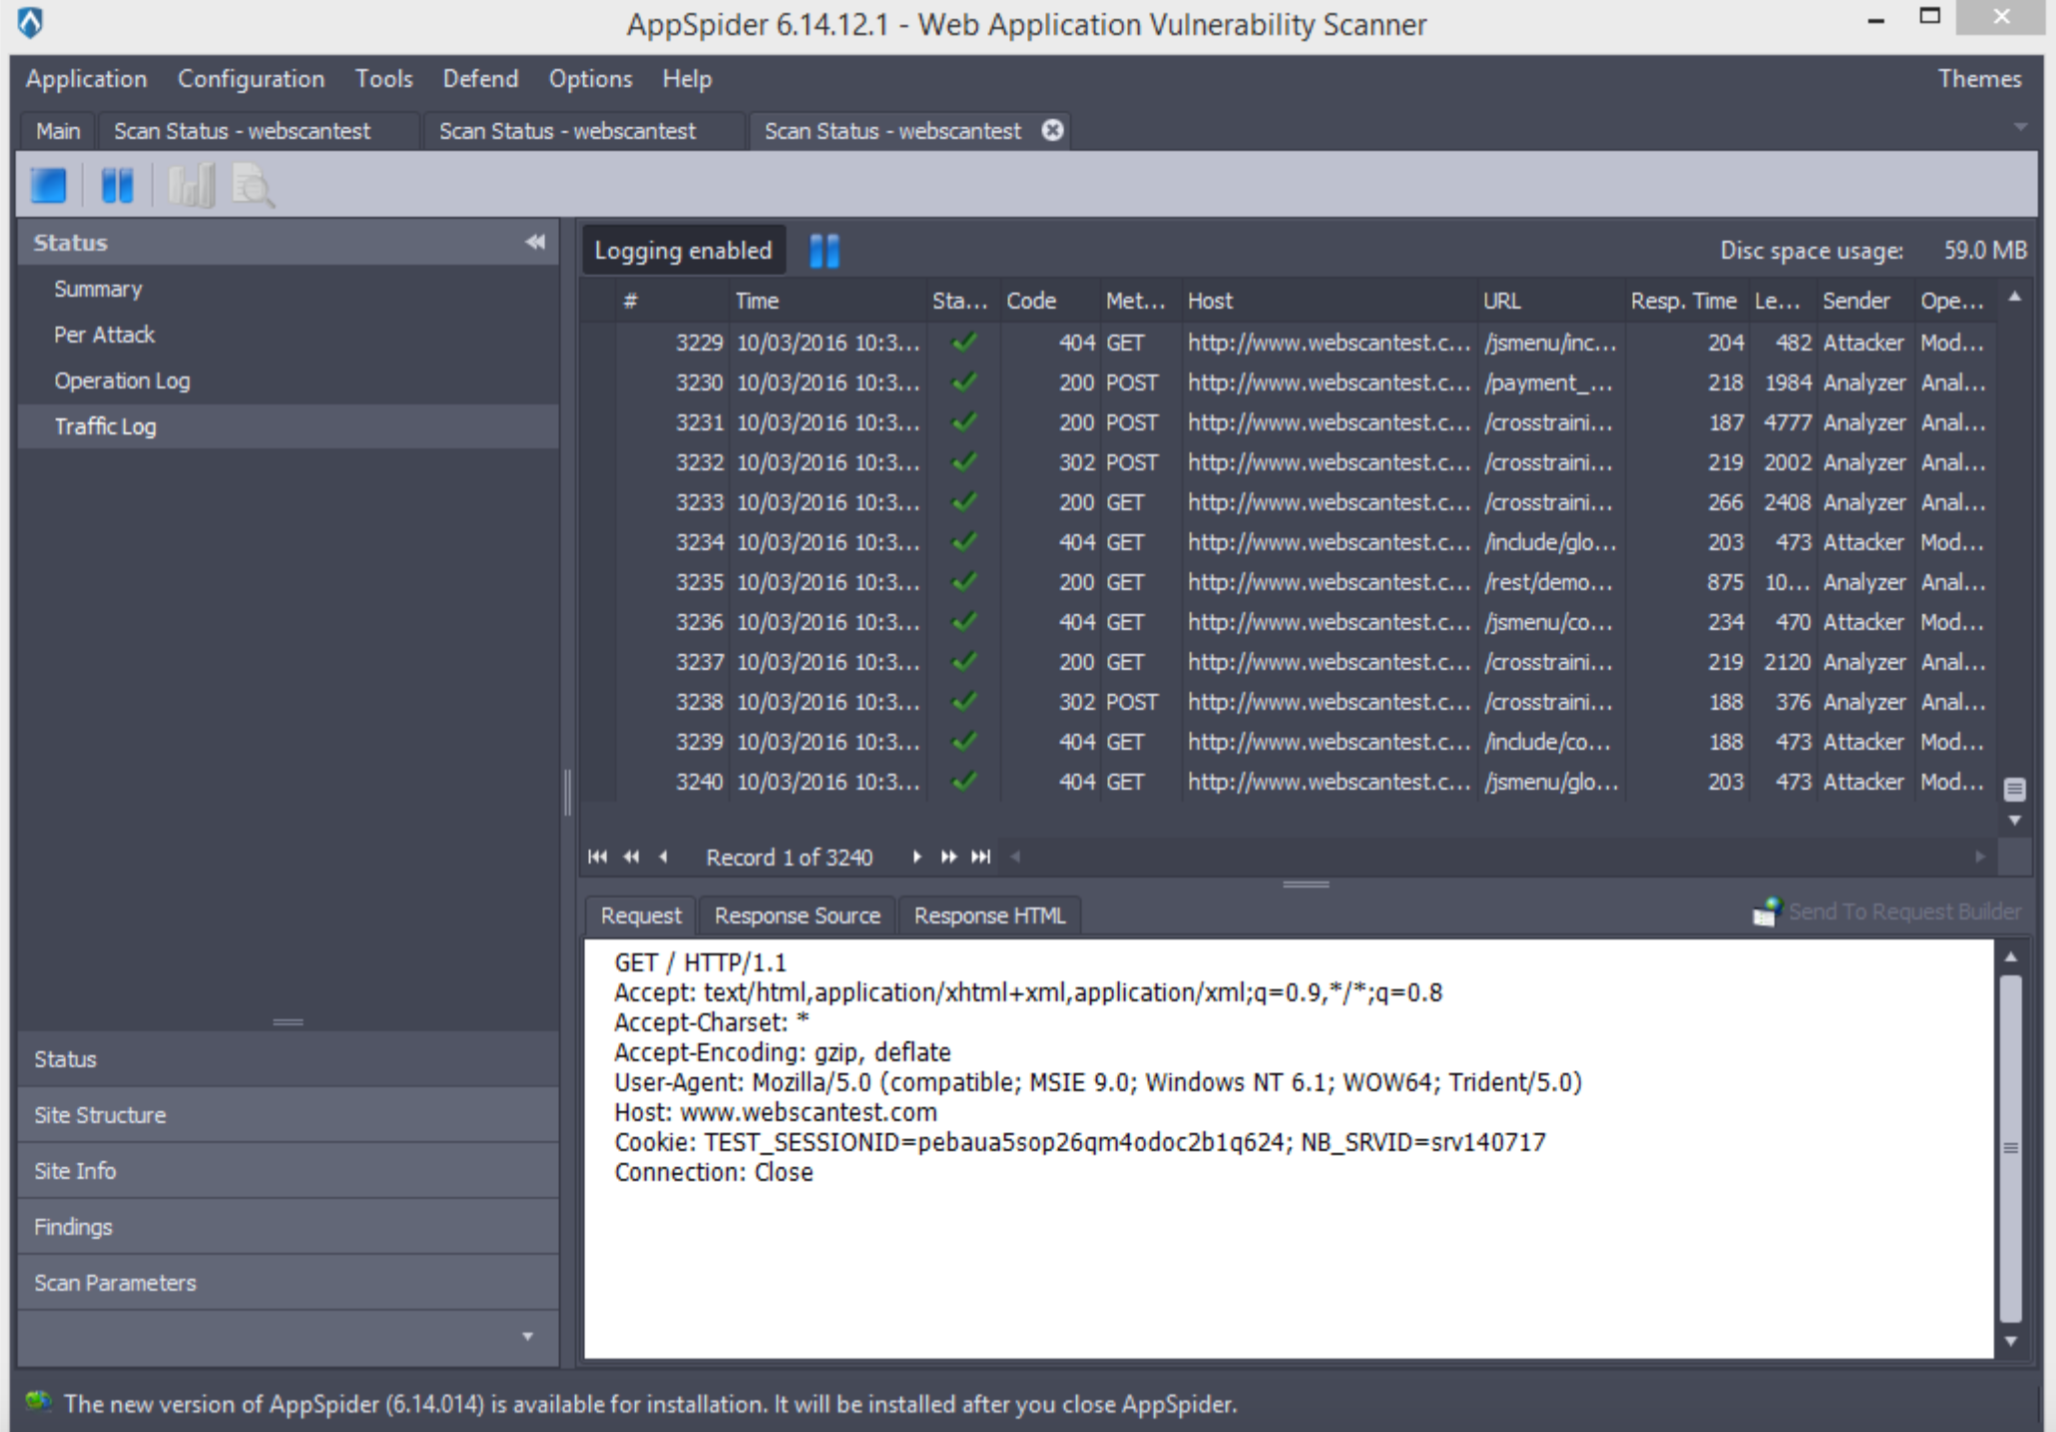
The “Logging enabled” button is displayed only when the scan is running.
- Pause: pauses logging
- Start: resumes logging Disk space usage is presented on the screen.
The table contains the following columns:
- Index: the number of the log entries
- Time: the time of the log entries
- Status: the status of the request
- Red Exclamation Point: Code = 0. Request failed. The server did not send any response
- Green Check Mark: Request succeeded. The response from the server was received.
- Code: response code
- Host: the host
- Url: the hosts relative URL
- Resp. time: the response time
- Length: the response length
- Sender: Indicates the component that initiated the request: Crawler, Login, Analyzer, Attacker.
- Operation: the operation name
Selecting any row will display detailed information in the tabs under the table.
- Request: the request that was sent
- Response Source: the response source
- Response HTML: the response HTML