Customizing Standard Reports
A standard report is based on a Metasploit report template, which controls the look and feel of the report. All reports have a cover page and include a set of options that enable you to manage the report data. You can customize some parts of a standard report, such as the logo and sections of content that appear in the report.
If you want to modify the layout of the report, you will need to use a custom template. Excluding Report Sections A report is made up of multiple sections. Each section divides the report content into distinct areas of information.
When you view the New Report form, you will see the sections that are available for the report you have selected. By default, all sections will be selected. If you want the report to only show certain sections of a report, you can exclude sections from the report.
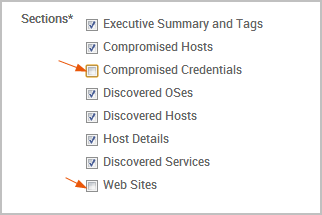
To exclude specific sections, you can deselect the sections you do not want to appear in the report.
When you generate the report, you will not see the excluded sections in the report. Additionally, the report will only show content for the sections for which it has data. Excluding and Including Hosts from Reports When you generate a report, Metasploit Pro automatically includes data from all hosts in the project. If you want to limit the data to a particular set of hosts, you can create an inclusion or exclusion list.
Creating Inclusion Lists
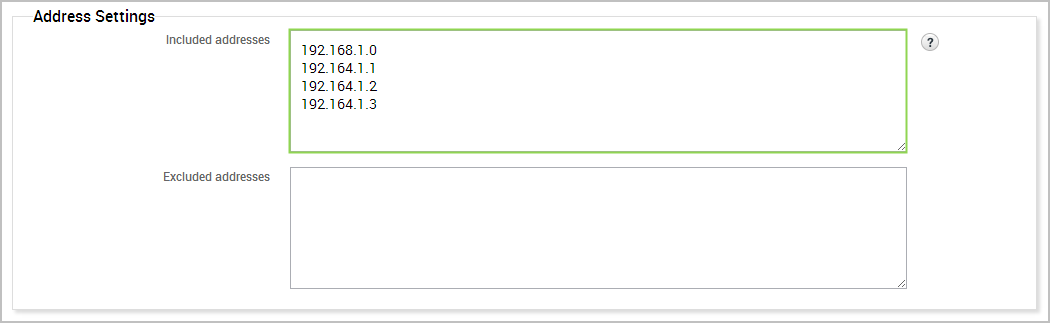
An inclusion list defines the hosts that you want to include in a report. Only the data for the hosts that you have explicitly defined will be displayed in the report.
You create an inclusion list from the New Report form. Use the Included addresses field to define the specific hosts you want to include in the report. You can enter a single IP address, an address range, or a CIDR notation. If there are multiple addresses or address ranges, use a newline to separate each entry.
Creating Exclusion Lists
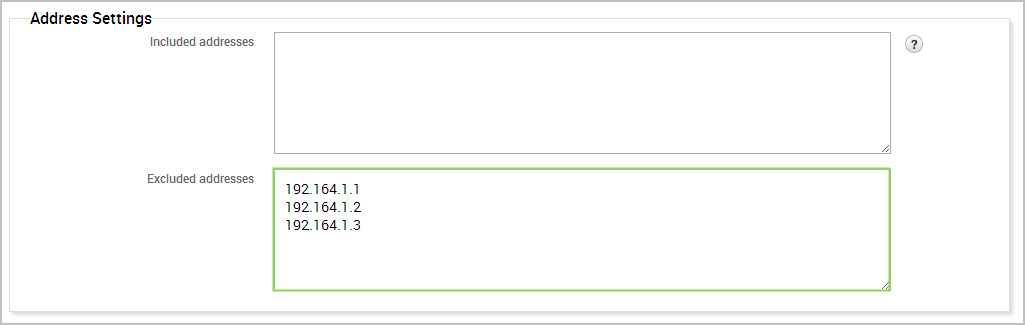
An exclusion list defines the hosts that you do not want to include in a report. The report will include data for all of the hosts in the project, except for the ones that you have defined in the exclusion list.
You create an exclusion list from the report generation form. Use the Excluded addresses field to define the specific hosts you want to exclude from the report. You can enter a single IP address, an address range, or a CIDR notation. If there are multiple addresses or address ranges, use a newline to separate each entry.
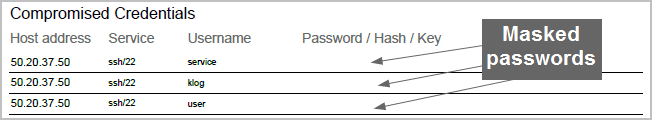
Masking Credentials from Reports You can mask credentials if you do not want to include the plain text passwords and hashes in the Audit, Authentication Tokens, FISMA, and PCI reports.
To mask credentials from a report, you need to select the credential masking option on the New Report form. Select the Mask discovered credentials option to enable credential masking in your report.
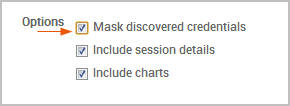
When the masking option is enabled, the reports will not display plaintext credentials. For example, when you view the generated Audit report, the Compromised Credentials section only shows the host addresses, services, and user names that were discovered. The password, hash, and key fields are blank.
Other reports, such as the PCI and FISMA reports, replace all credentials with <blank>.
Removing Charts from Reports
Charts visually present numerical data. They are effective when you use to them present and compare large sets of information. You can include them in a report to simplify quantitative data and to highlight trends in your findings. Reports mostly use pie charts to illustrate how data is distributed across different categories.
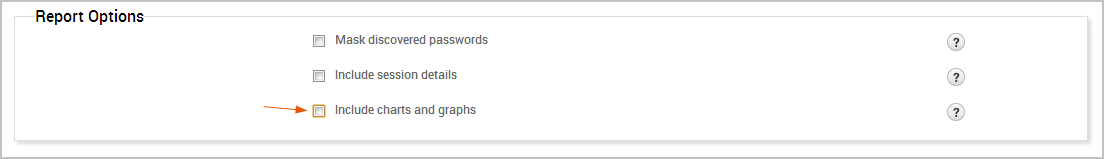
Most reports, with the exception of the FISMA, PCI, Social Engineering, Web Application Assessment, and Activity reports, have the option to include charts. By default, this option is enabled, so charts will be automatically generated for applicable reports. If you do not want to include charts in your report, you can disable the charts and graphs option.
To exclude charts and graphs from a report, deselect the Include charts and graphs option.
Including Web Page HTML in Social Engineering Reports The Social Engineering Report presents the findings and data for a particular campaign. It contains the details for the campaign components that you used to build the campaign, such as the target list, email, and web pages used.
The raw content for the target list and email will automatically be included in the report. If you want to include the raw content for the web pages, you will need to enable the Include web page HTML option. If enabled, this option includes the HTML for each web page used in the campaign. A preview of the web page will render in the report if the web page was used as part of a campaign.

If the web page delivered malicious code, such as a client-side exploit, Java applet, or executable file, a preview will not be rendered for the web page.
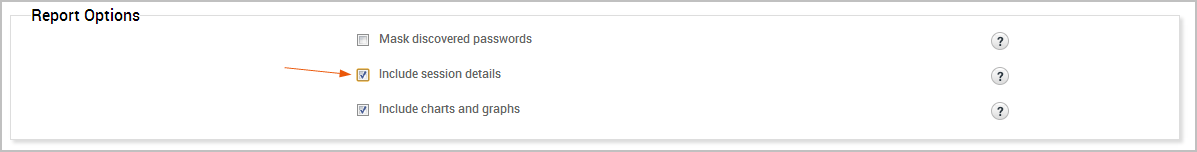
Excluding Session Details The Audit report provides a detailed and comprehensive snapshot of the active services and vulnerabilities that were discovered on targeted hosts. If you were able to successfully open a session on a target host, you can include the session details in the report as well.
The session details will show timestamps for when a session was opened and closed. If you were able to obtain data from a session, such as ARP tables, SSH keys, and shadow files, the raw content for each file will be included in the Audit report.
The Audit report will include the session details by default. To exclude the details from an opened session, select the Include session details option.
Customizing Report Names
Metasploit uses the following naming convention for report names: <report type>-<timestamp>. The report name appears in the Reports list.
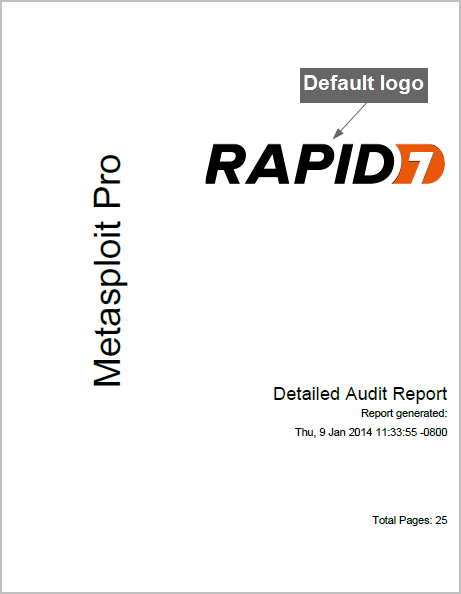
You can change the name by replacing the default name in the Report Name field on the New Report form. Adding a Custom Logo to a Report All reports include a cover page that displays the title, logo, and timestamp. The cover page displays the Rapid7 image as the default logo on all reports.
If you want to replace the default logo, you can upload a JPG, GIF, or PNG file. The uploaded logo can be used to brand a report with your organization’s identity. The logo appears in the right side of the cover page and replaces the default Rapid7 logo.
Logo Requirements
The logo area on the cover page is 320 x 320 pixels. You can upload an image that is larger than the logo area, but the logo will be resized to fit the cover page.
If the image is larger than the logo area, the height of the image will be preserved, but the width will be resized.
Uploading a Custom Logo
- Open the project that you want to upload the logo to.
- Select Reports > Create Custom Report from the Project tab bar.
The Reports page appears. 3. Find the Custom Report Collateral area.
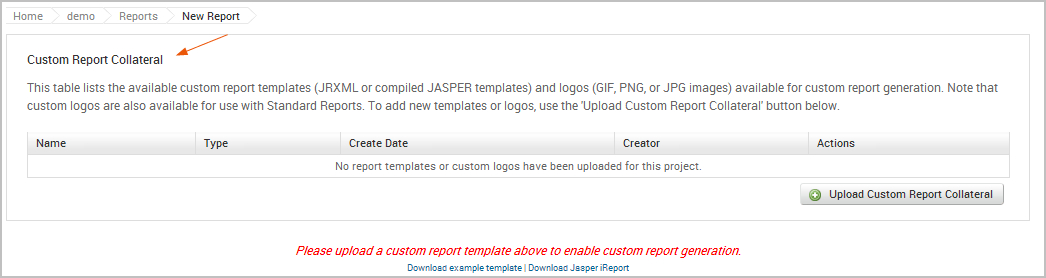
- Click the Upload Custom Report Collateral button.
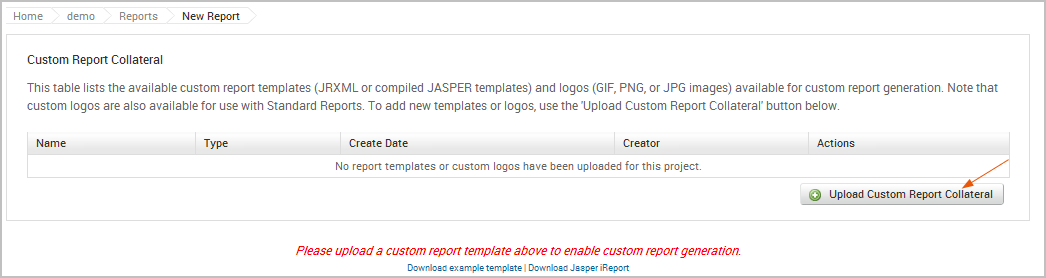
The Upload window appears. 5. Click the Choose File button.
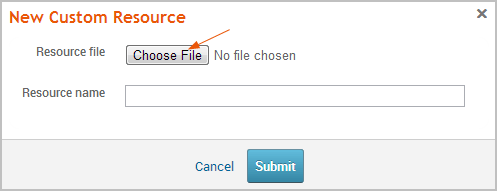
The Open dialog window appears. 6. Browse to the location of the logo file. You can upload a GIF, JPEG, JPG, or PNG file. 7. Select the logo file and click the Open button. 8. Enter a name for the file in the Descriptive Name field. (Optional)

If you do not specify a name, the Custom Report Collateral area shows the original file name. 9. Click the Upload button.
The file appears under the Custom Report Collateral area.
Adding a Custom Logo to a Standard Report
To use a custom logo on the report’s cover page, you need to click the Custom report logo dropdown on the New Report form and select the image you want to use. The dropdown will show the logos that have been uploaded to the project.
If the project does not contain any logos, the New Report form will display a link to the Custom Reports page where you can upload your logo.