Passive Network Discovery MetaModule
In situations where active scanning causes instability in the target network, you can run a passive network scan to avoid detection and reduce disruptions. A passive network scan stealthily monitors broadcast traffic to identify the IP addresses of hosts on the network. By initially running a passive scan, you can identify known hosts while evading network monitoring tools, such as intrusion detection systems (IDS). The data obtained from a passive network scan can be used to perform a targeted active scan with Metasploit’s Discovery Scan.
The Passive Network Discovery MetaModule runs a live packet capture on a specific network interface to capture packets. If you want to have more granular control over the packet capture, or you want to reduce the size of the packet capture, you can use Berkeley Packet Filters (BPF) to specify the types of packets that the MetaModule captures.
The packet capture runs until it reaches the maximum Pcap file size or the time limit you have configured for the MetaModule. When the MetaModule run completes, it stores the captured data and can generate a comprehensive report of its findings which includes information about the hosts that have been discovered or services and credentials that the MetaModule has found or captured.
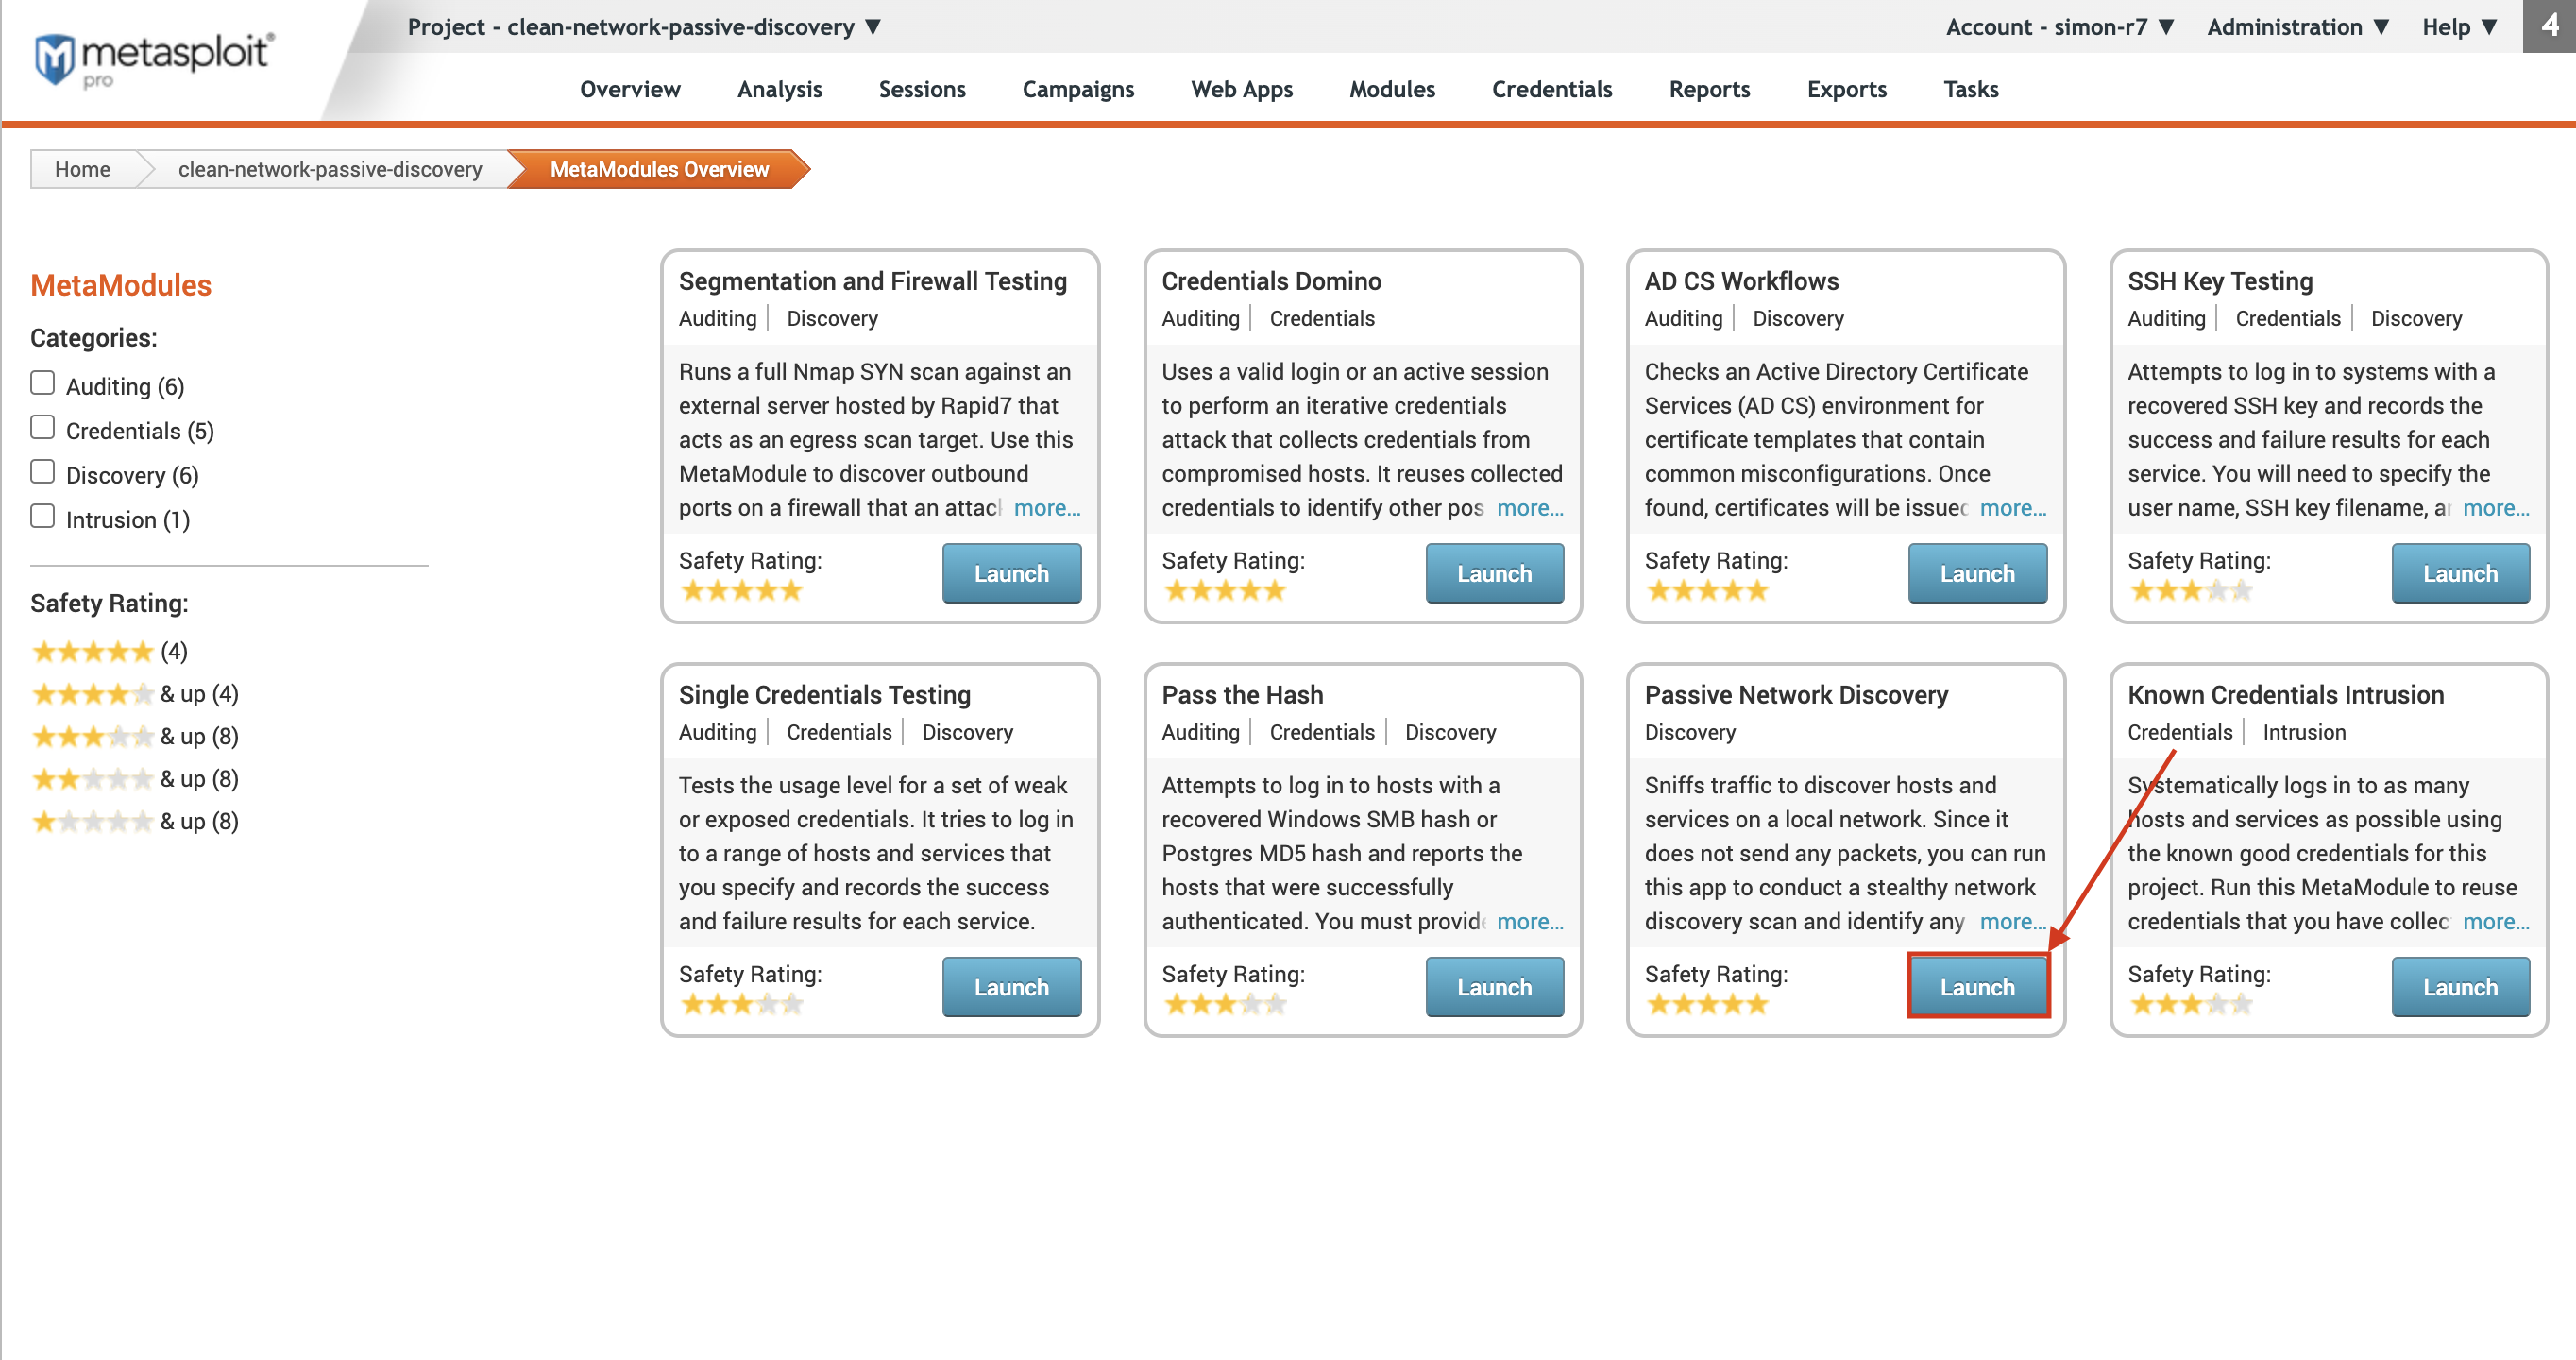
This MetaModule would ideally be executed on a machine with two network interfaces (one that Metasploit Pro runs on, and one used to listen for incoming packets), and in an environment where port mirroring has been set up on a network switch, to mirror packets for Metasploit Pro to capture. For details on how to do this, refer to documentation provided by the vendor of your networking equipment. Accessing the Passive Network Discovery MetaModule You can access the Passive Network Discovery MetaModule from the MetaModules page. To access the MetaModules page, select Modules > MetaModules from the Project tab bar. Find the Passive Network Discovery MetaModule and click the Launch button.
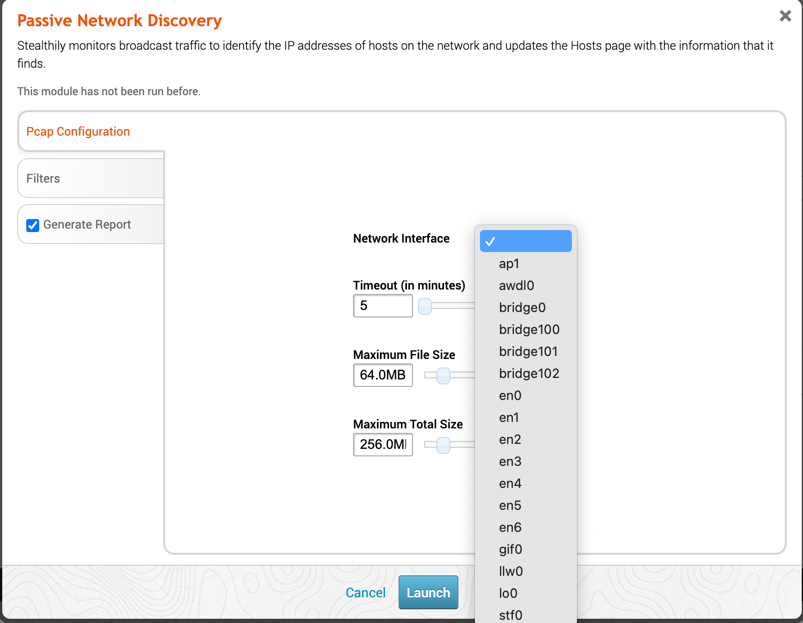
The Passive Network Discovery MetaModule configuration window appears with the Pcap Configuration form displayed. Each configuration step is divided into separate tabs, so you can click on any of the tabs to switch between the different configuration forms.
Pcap Configuration The first thing you need to do when you configure the Passive Network Discovery MetaModule is select the network interface that will be listening for incoming network packets. Here, you can also configure the following limits:
- Timeout - The time limit for the capture, in seconds.
- Max File Size - The maximum file size for each file captured, up to 512 MB.
- Max Total Size - The maximum size of the entire Pcap file, up to 2GB. This value must be larger than the Max File Size. The packet capture runs until it meets the timeout limit or the maximum Pcap file size limit.
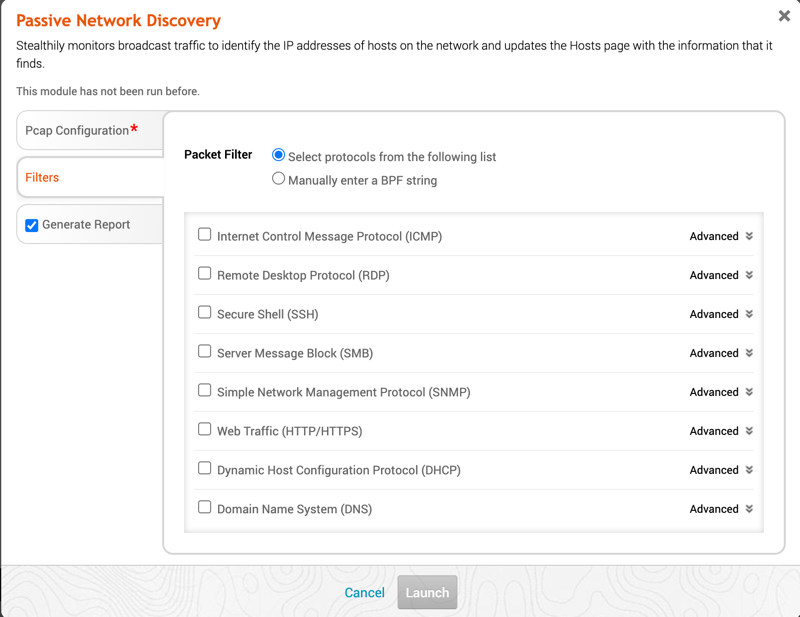
Filters On the Filters tab, you will be able to either input your own BPF filter, or enable any combination of the available filters in the UI. This filter specifies what packets will be capture by the MetaModule. The Generated BPF String window will automatically update upon selecting or unselecting UI elements. It will also be shown on the generated output report. The current list of available filters include:
- Internet Control Message Protocol (ICMP)
- Remote Desktop Protocol (RDP)
- Secure Shell (SSH)
- Server Message Block (SMB)
- Simple Network Management Protocol (SNMP)
- Web Traffic (HTTP/HTTPS)
- Dynamic Host Configuration Protocol (DHCP)
- Domain Name System (DNS)
However, more complex scenarios can be handled by specifying a Custom BPF String.
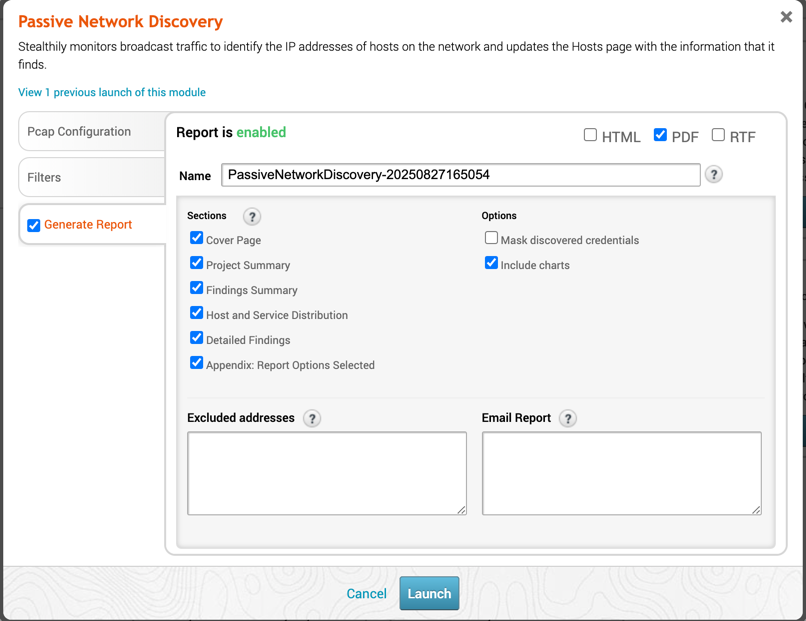
Report Generation On the Report tab, you will be able to specify which sections of the report you would like to include or exclude, as well as optionally specify email addresses that the generated report should be sent to. Note: If you want to e-mail a report, you must set up a local mail server or e-mail relay service for Metasploit Pro to use. To define your mail server settings, select Administration > Global Settings > SMTP Settings.
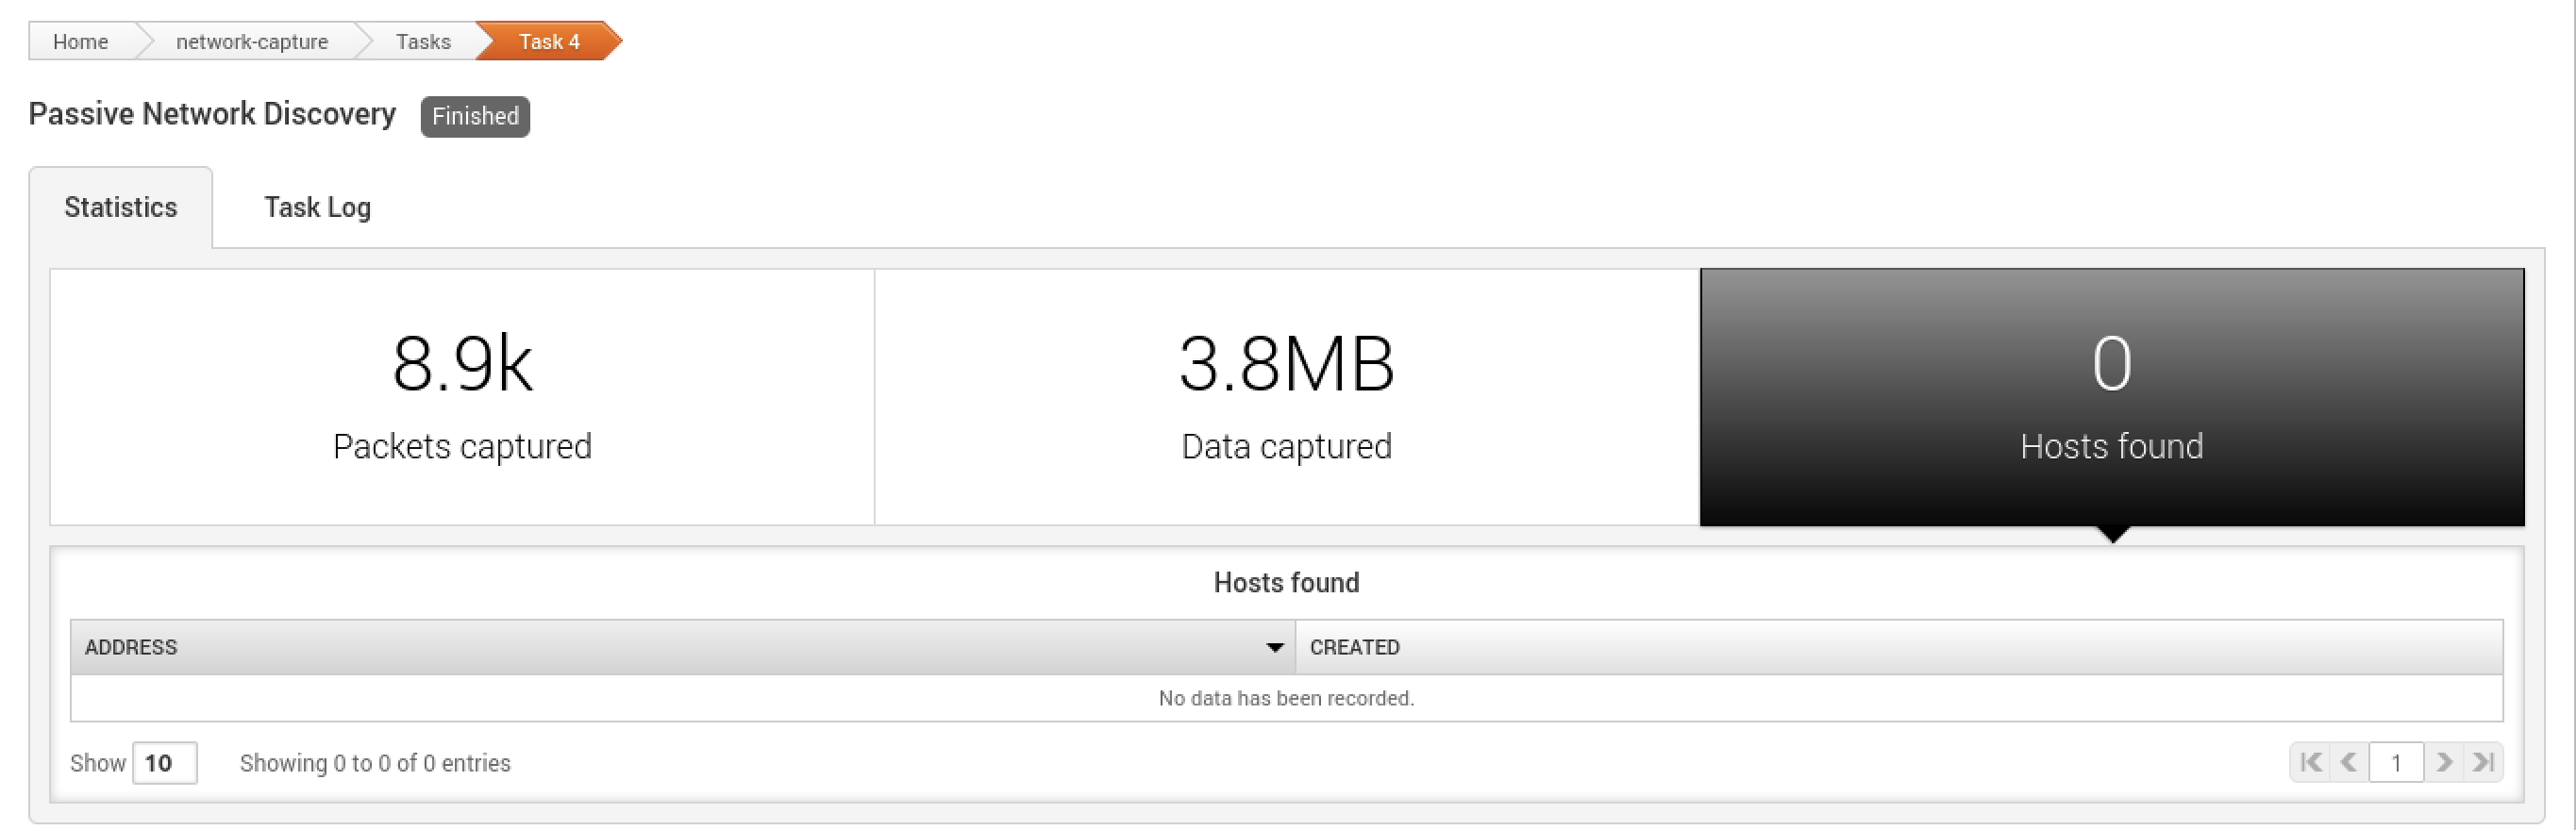
When the MetaModule launches, the Findings window appears. It contains the statistics and task log for the MetaModule run. You can track the total number of packets, bytes, and hosts that the MetaModule captures in real-time.
After the MetaModule completes its run, you should go the Reports area to view the Passive Network Discovery Findings Report that the MetaModule generated. The report provides detailed information about the services and credentials that the MetaModule was able to capture for each host, as well as a graphical breakdown of the operating systems and services that were found.