Tracking Real-Time Statistics and Events
The Findings window displays the real-time statistics for the test and the task log. You can click on the tabs at the top of the Findings window to switch between the real-time statistics and the task log. You can also automatically push validated vulnerabilities and access the Vulnerabilities Exceptions configuration page.
Accessing the Findings Window
The Findings window automatically appears when you start the Vulnerability Validation Wizard. If you navigate away from the Findings window, you can go to the Tasks page to access it again.
To access the Findings Window:
- From within a project, select Tasks > Show Tasks from the Project Tab bar. The Tasks page appears.
- Find the Vulnerability Validation task.
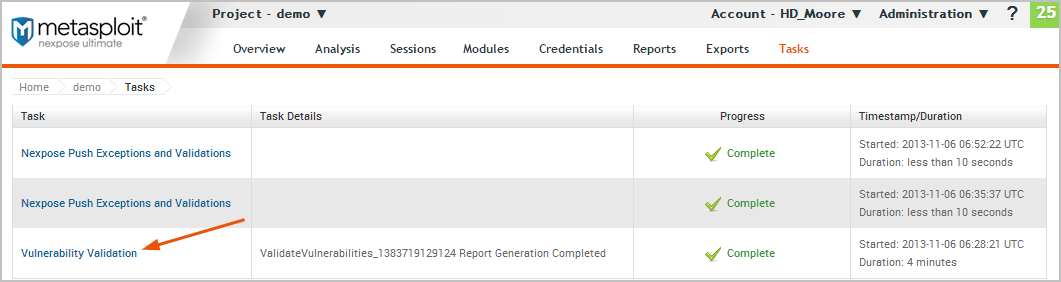
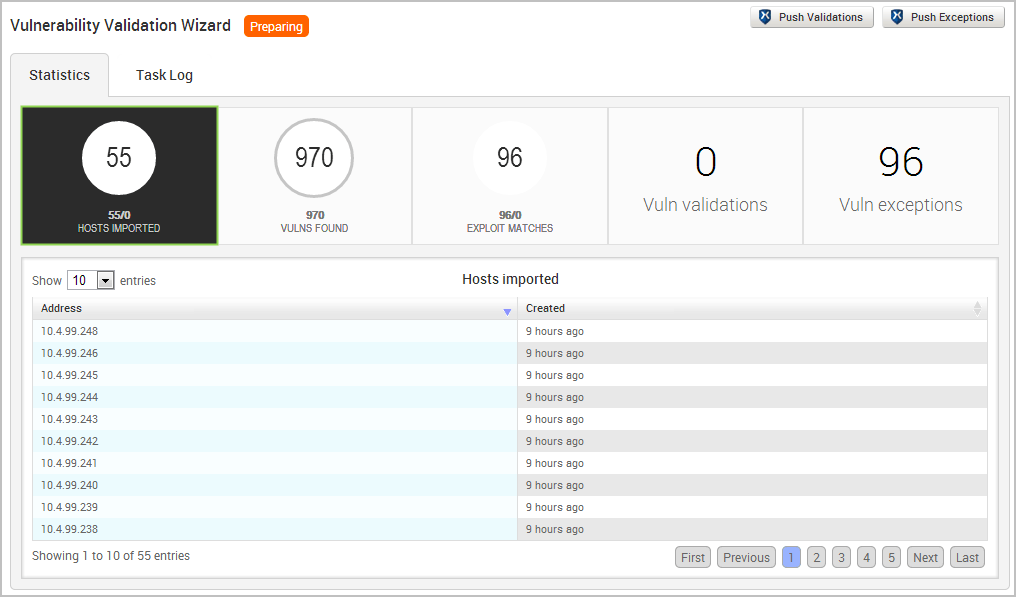
- Click the Vulnerability Validation task name. The Findings window appears. The Statistics Tab The Statistics tab shows a high-level, count of hosts, vulnerabilities, and exploits. Each value is displayed in a stat bubble with an orange progress bar. The progress bar wraps around the stat bubble and only displays when there is activity occurring for a particular finding.
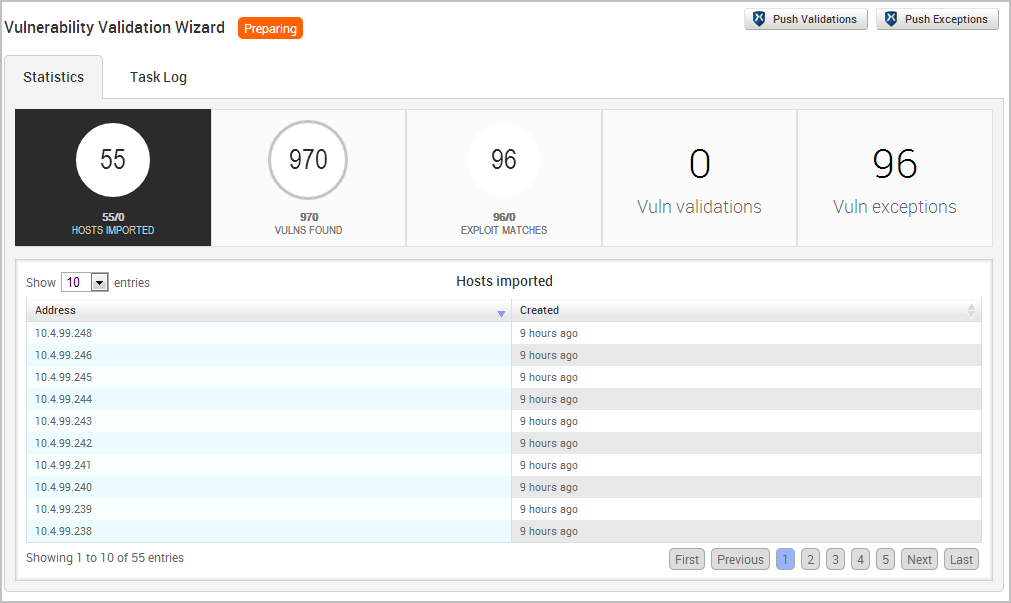
From the Statistics tab, you can track the following data:
- The total number of hosts that have been scanned or imported.
- The total number of unique vulnerabilities that have been identified.
- The total number of exploit modules that match Nexpose vulnerabilities.
- The total number of vulnerabilities that Metasploit Pro was able to exploit.
- The total number of vulnerabilities that Metasploit Pro was unable to exploit.
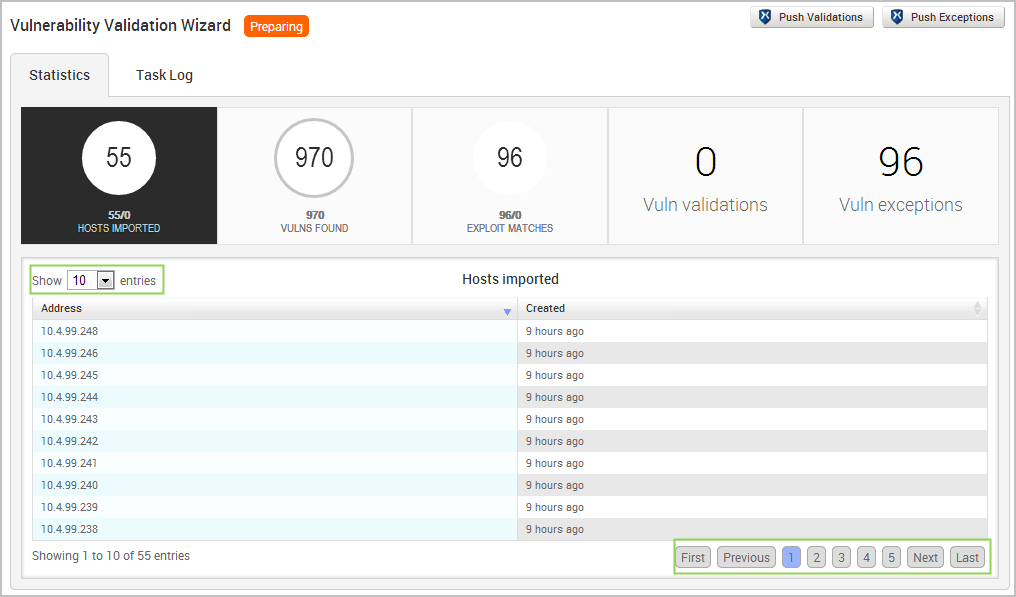
Viewing a List of Imported Hosts from the Findings Window
- Open the Findings Window.
- Click on the Hosts Imported tab. The Hosts list appears and displays the IP addresses for each host that has been imported from a Nexpose site.
- Use the navigational page buttons to view more hosts or click the Show Entries dropdown to expand the number of hosts displayed.
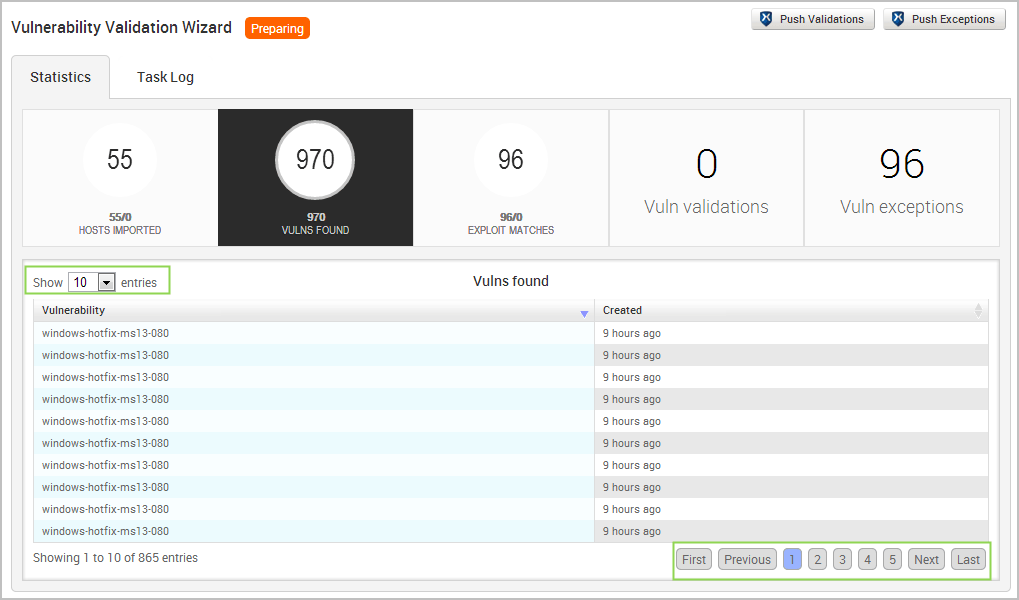
Viewing a List of Imported Vulnerabilities from the Findings Window
- Open the Findings Window.
- Click the Vulns Found tab. A list of imported vulnerabilities appears.
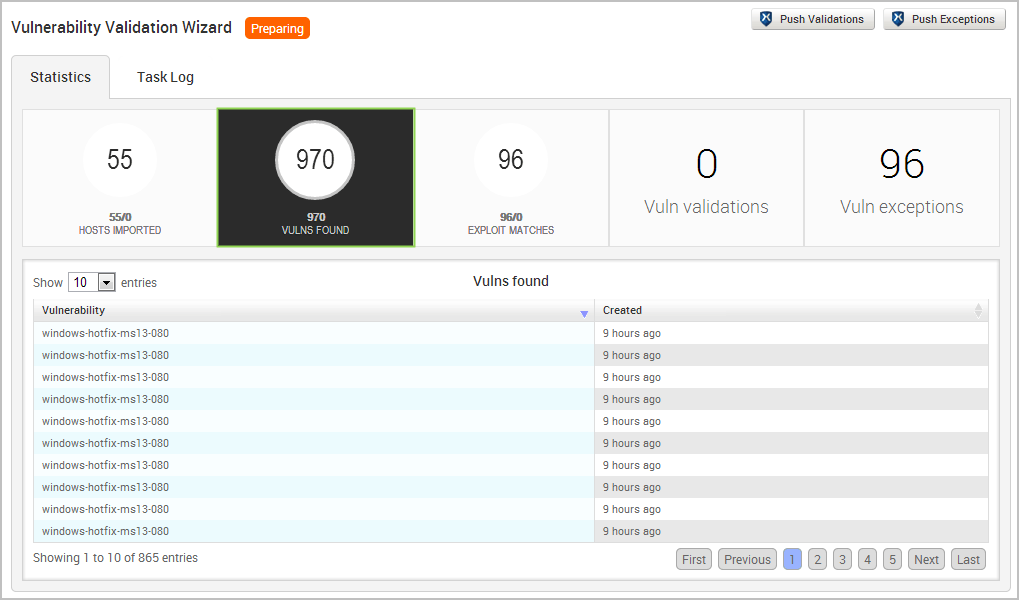
- Use the navigational page buttons to view more hosts or click the Show Entries dropdown to expand the number of vulnerabilities displayed.
Viewing a List of Exploit Matches from the Findings Window
- Open the Findings Window.
- Click the Exploit Matches tab. A list of imported vulnerabilities appears.
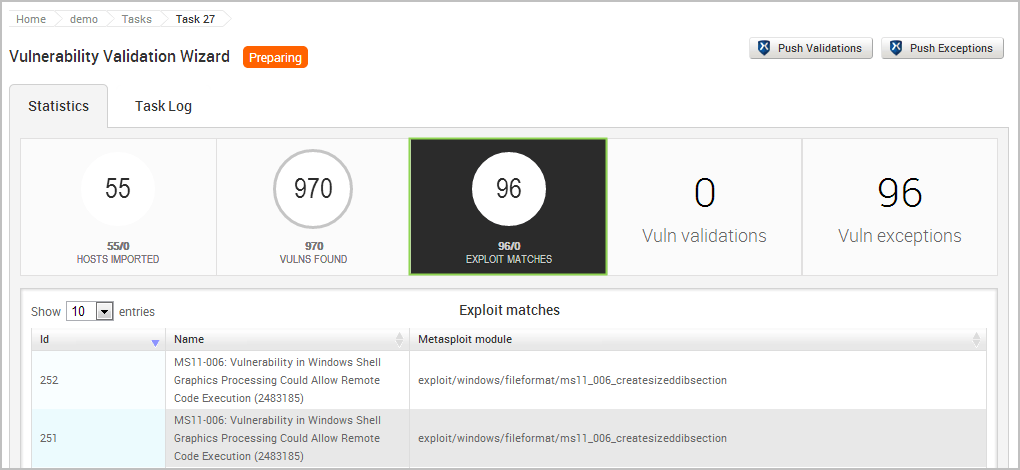
- Use the navigational page buttons to view more hosts or click the Show Entries dropdown to expand the number of exploit modules displayed.
Viewing a List of Validated Vulnerabilities from the Findings Window
- Open the Findings Window.
- Click the Vulns validations tab. A list of imported vulnerabilities appears.
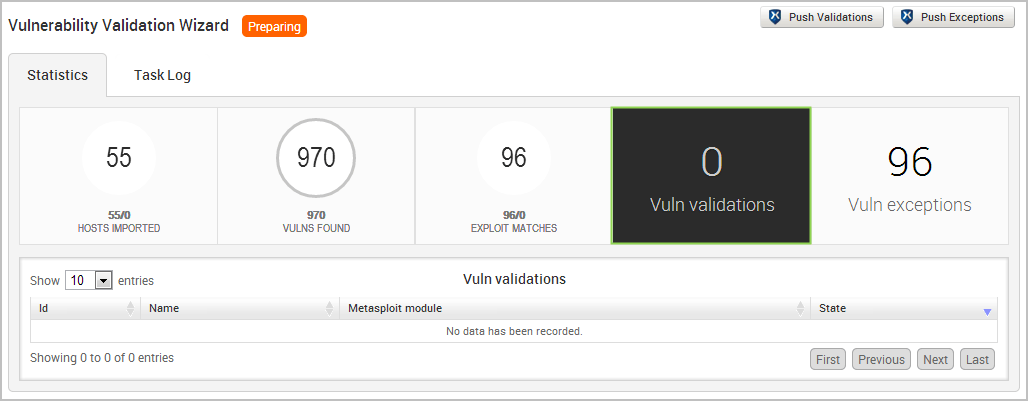
You can view the vulnerability name, the exploit module that was run against the vulnerability, and the result of the exploit. For vulnerability validations, the state will be exploited.
3. Use the navigational page buttons to view more hosts or click the Show Entries dropdown to expand the number of validations displayed.
Viewing a List of Vulnerability Exceptions from the Findings Window
- Open the Findings Window.
- Click the Vulns exceptions tab. A list of vulnerability exceptions appears.
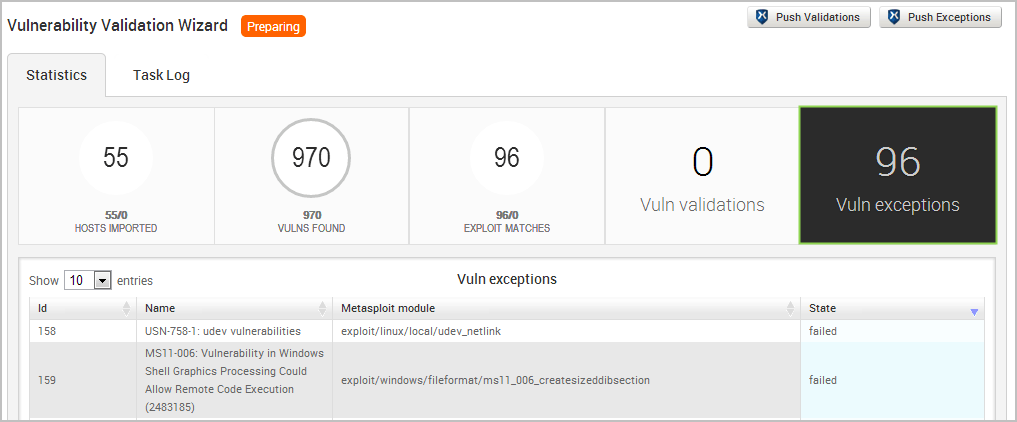
You can view the vulnerability name, the exploit module that was run against the vulnerability, and the result of the exploit. For vulnerability exceptions, the state will be failed.
3. Use the navigational page buttons to view more hosts or click the Show Entries dropdown to expand the number of exceptions displayed.
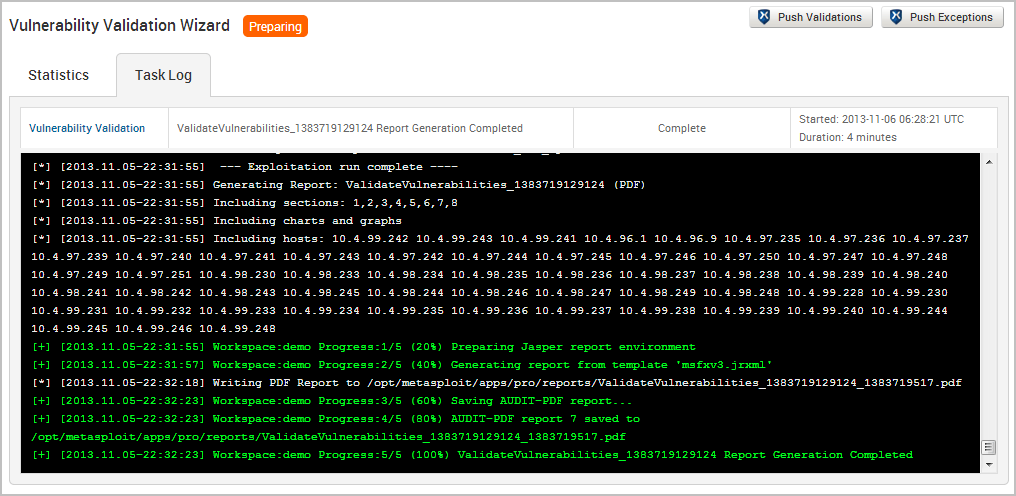
The Tasks Log Tab
The Tasks Log tab shows a detailed activity log for the Vulnerability Validation Wizard. Each task that Metasploit Pro performs is documented in the Tasks Log. For example, you can view the assets and vulnerability definitions as they are being imported into a project or you can view the exploit modules as they are being run. If you have chosen to perform a dry run of the auto-exploitation task, you can go to the Tasks Log to view the proposed attack plan.
Additionally, the Tasks Log shows you the current state of the test, the start time of the test, and the amount of time that the test has been running.