Troubleshooting
It is important to be able to debug and troubleshoot when developing plugins.
UI
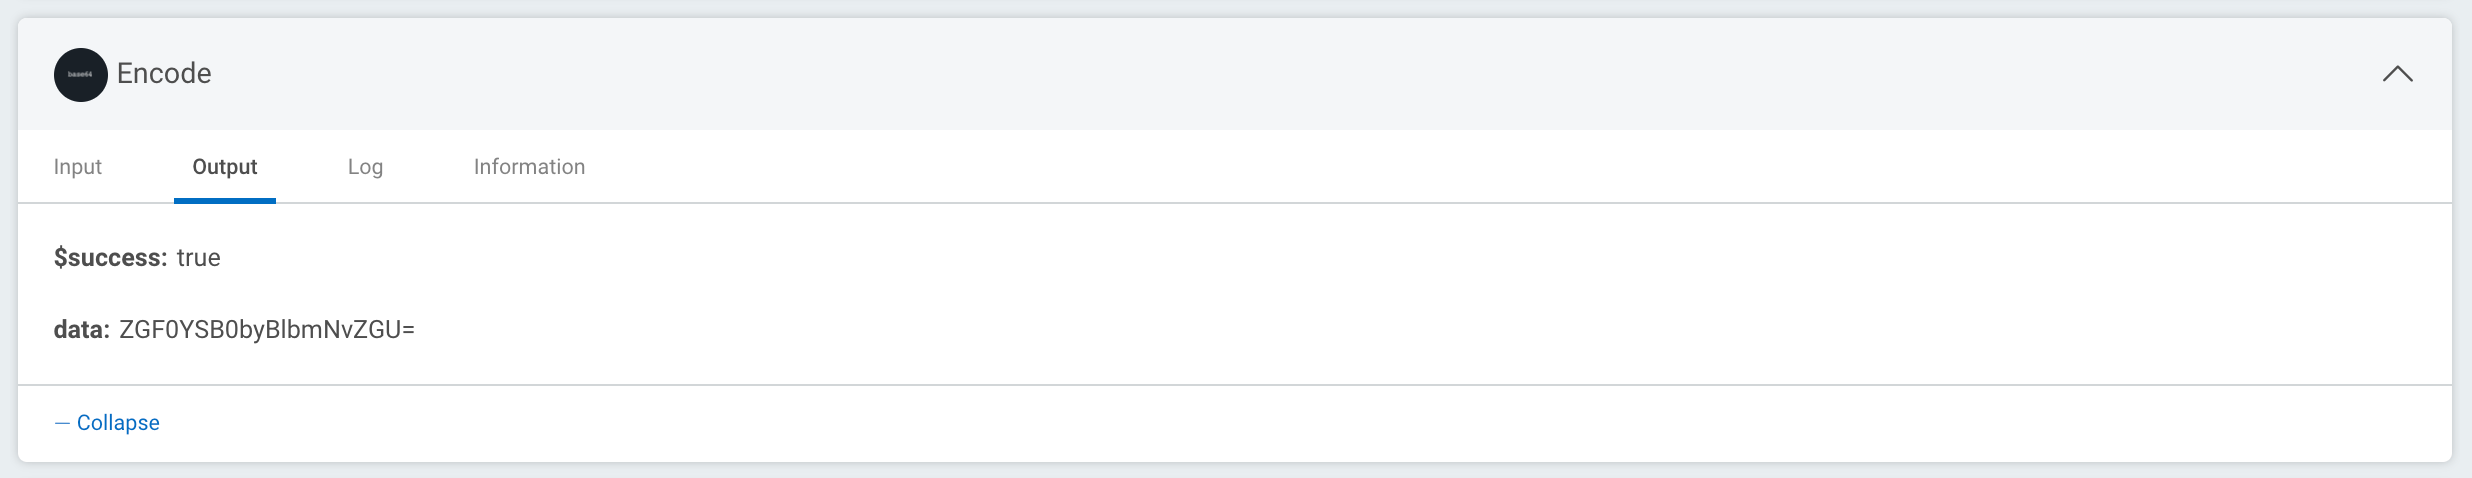
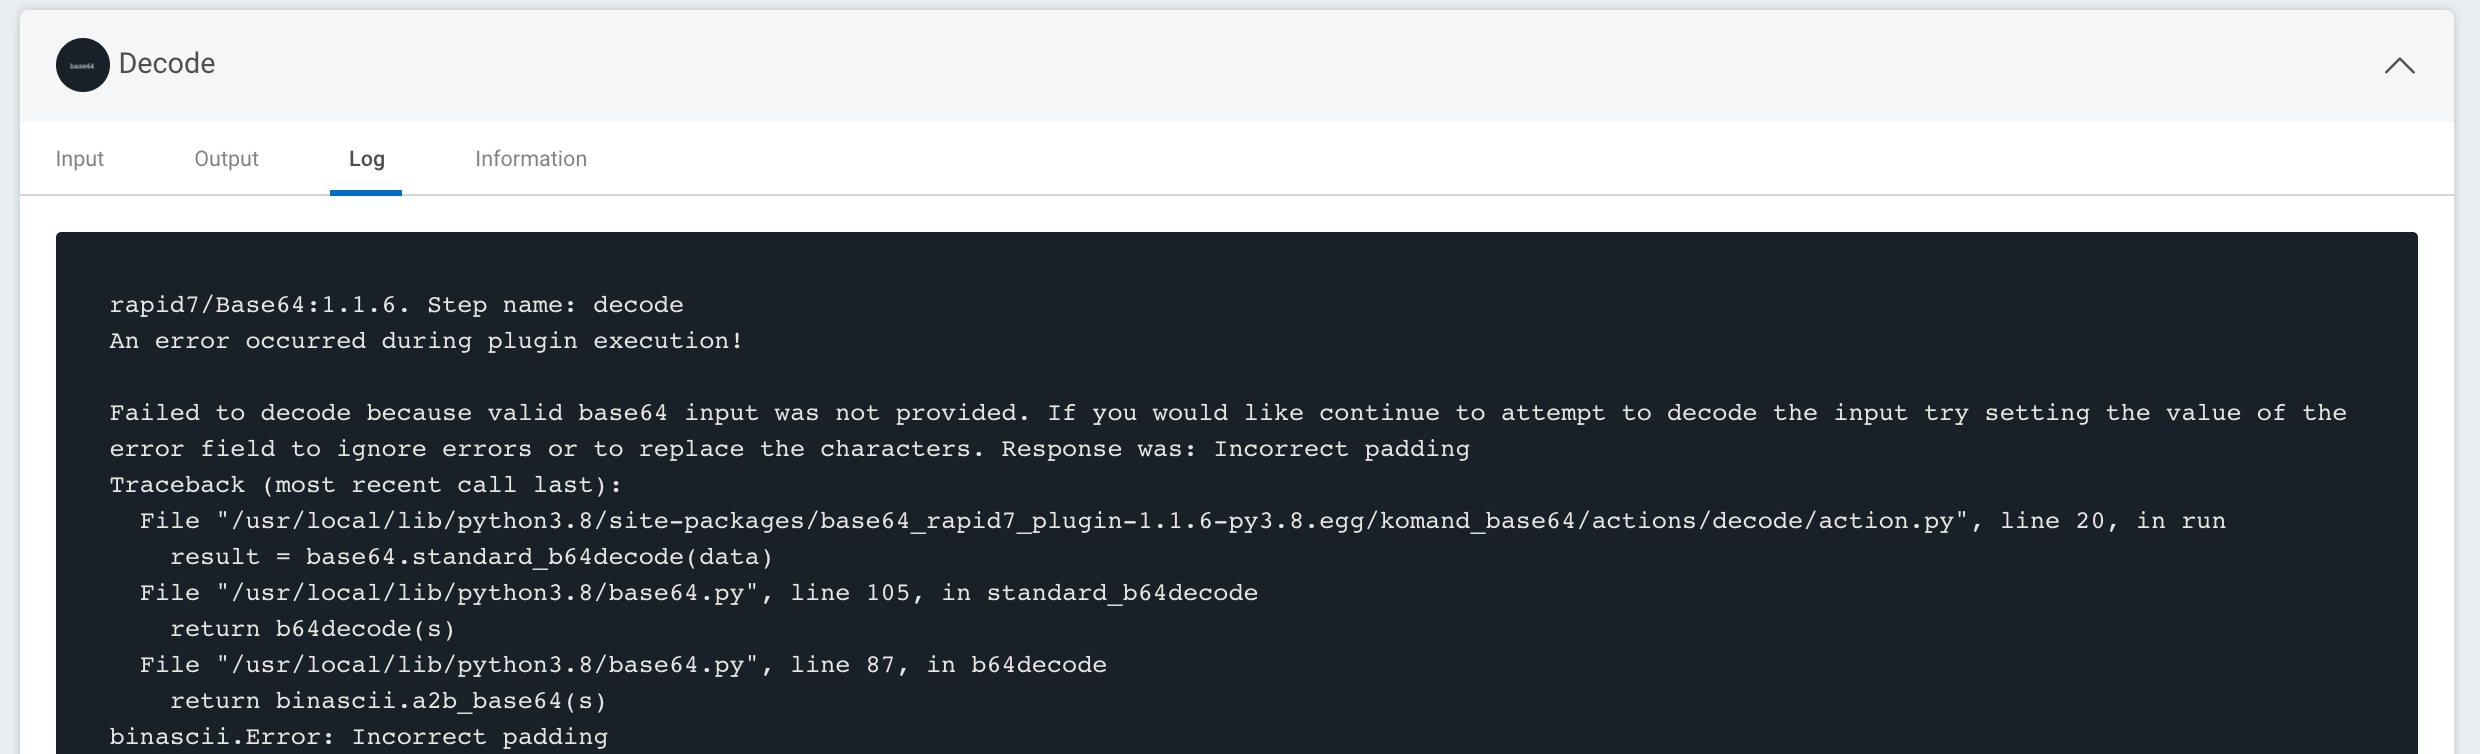
Errors and debug information can be found in the UI on the job page by viewing the Error and Log tabs.
Logs
The engine and web services contain logs that may help diagnose issues.
Enable debug logging to get the most out of them by adding the following line to /opt/komand/etc/web.conf and /opt/komand/etc/engine.conf:
KOMAND_LOG_LEVEL=debug
Then restart the services:
systemctl restart komand-engine
systemctl restart komand-web
Now, investigate the logs:
tail -f /var/log/komand/web.log
tail -f /var/log/komand/engine.log
Containers
You can view logs of running containers by interacting with Docker. This is helpful in cases where no jobs are created by a trigger in the UI. To do this, you will need to be on an Automation (InsightConnect) orchestrator or on a Komand host with a privileged account such as root.
Obtain container ID:
root@localhost ~]# docker ps
CONTAINER ID        IMAGE                  COMMAND                  CREATED             STATUS              PORTS
NAMES
ba7cdcd752fb        komand/twitter:1.0.0   "/usr/local/bin/koman"   12 minutes ago      Up 12 minutes
View logs in realtime from running container by ID:
[root@localhost ~]# docker logs -f ba7cdcd752fb
INFO:root:Using dispatcher config: {u'url':
u'http://127.0.0.1:8000/v2/workflows/0a64d852-8384-43f3-b29e-1be835b3b018/events?internal=1&api_key=2981d3fb-d7ca-47d7-9a05-ceb2123271d2'}
INFO:root:Connect: Creating Twitter client.
INFO:root:Right about to create API client
INFO:root:API Client created
INFO:requests.packages.urllib3.connectionpool:Starting new HTTPS connection (1): api.twitter.com
INFO:requests.packages.urllib3.connectionpool:Starting new HTTPS connection (1): api.twitter.com
INFO:root:Connect: Connected! ID: 778783652834582529, Username: Rusty Shackleford, ScreenName: DoctorPeepers12
INFO:root:OpenCacheFile: /var/cache/triggers_twitter_messages exists, returning it
INFO:root:Run: Iterating main loop
INFO:root:OpenCacheFile: /var/cache/triggers_twitter_messages exists, returning it
INFO:root:Run: Cached id is 787384615166152708.
INFO:requests.packages.urllib3.connectionpool:Starting new HTTPS connection (1): api.twitter.com
INFO:root:Get Messages: Got 0 messages.
INFO:root:Get Messages: Next sleep duration set to 360 seconds.
INFO:root:Run: No new messages. Sleeping 360 seconds.
You can also debug a running plugin container live using the side-car container method. We have prepared a debugging container with basic tools that you can pull down with
# docker pull komand/python-debug-slim-plugin
Once you have the debugging image, find the container ID or name of a running plugin container that you would like to debug:
# docker ps
e0a52e7da434        rapid7/kafka:1.0.2                       "/komand/plugins/bin…"   4 weeks ago         Up 4 weeks          0.0.0.0:10002->10001/tcp   rapid7_kafka_1.0.2_action
Next, we run the debugging container with settings to attach it to the process and network namespace of the running plugin container. And finally, we start calling debugging tools on the plugin process:
# docker run --rm -it --privileged --pid=container:rapid7_kafka_1.0.2_action --net=container:rapid7_kafka_1.0.2_action komand/python-debug-slim-plugin bash
bash-4.4# ps
PID   USER     TIME  COMMAND
    1 root      1:03 /komand/plugins/bin/kafka http
   13 root      0:00 bash
   19 root      0:00 ps
bash-4.4# strace -p 1
strace: Process 1 attached
futex(0xb39f18, FUTEX_WAIT, 0, NULL
...
bash-4.4# netstat -plunt
Active Internet connections (only servers)
Proto Recv-Q Send-Q Local Address           Foreign Address         State       PID/Program name
tcp        0      0 :::10001                :::*                    LISTEN      1/kafka
You can see that we’re able to access the processes and network of the attached plugin container.
UI
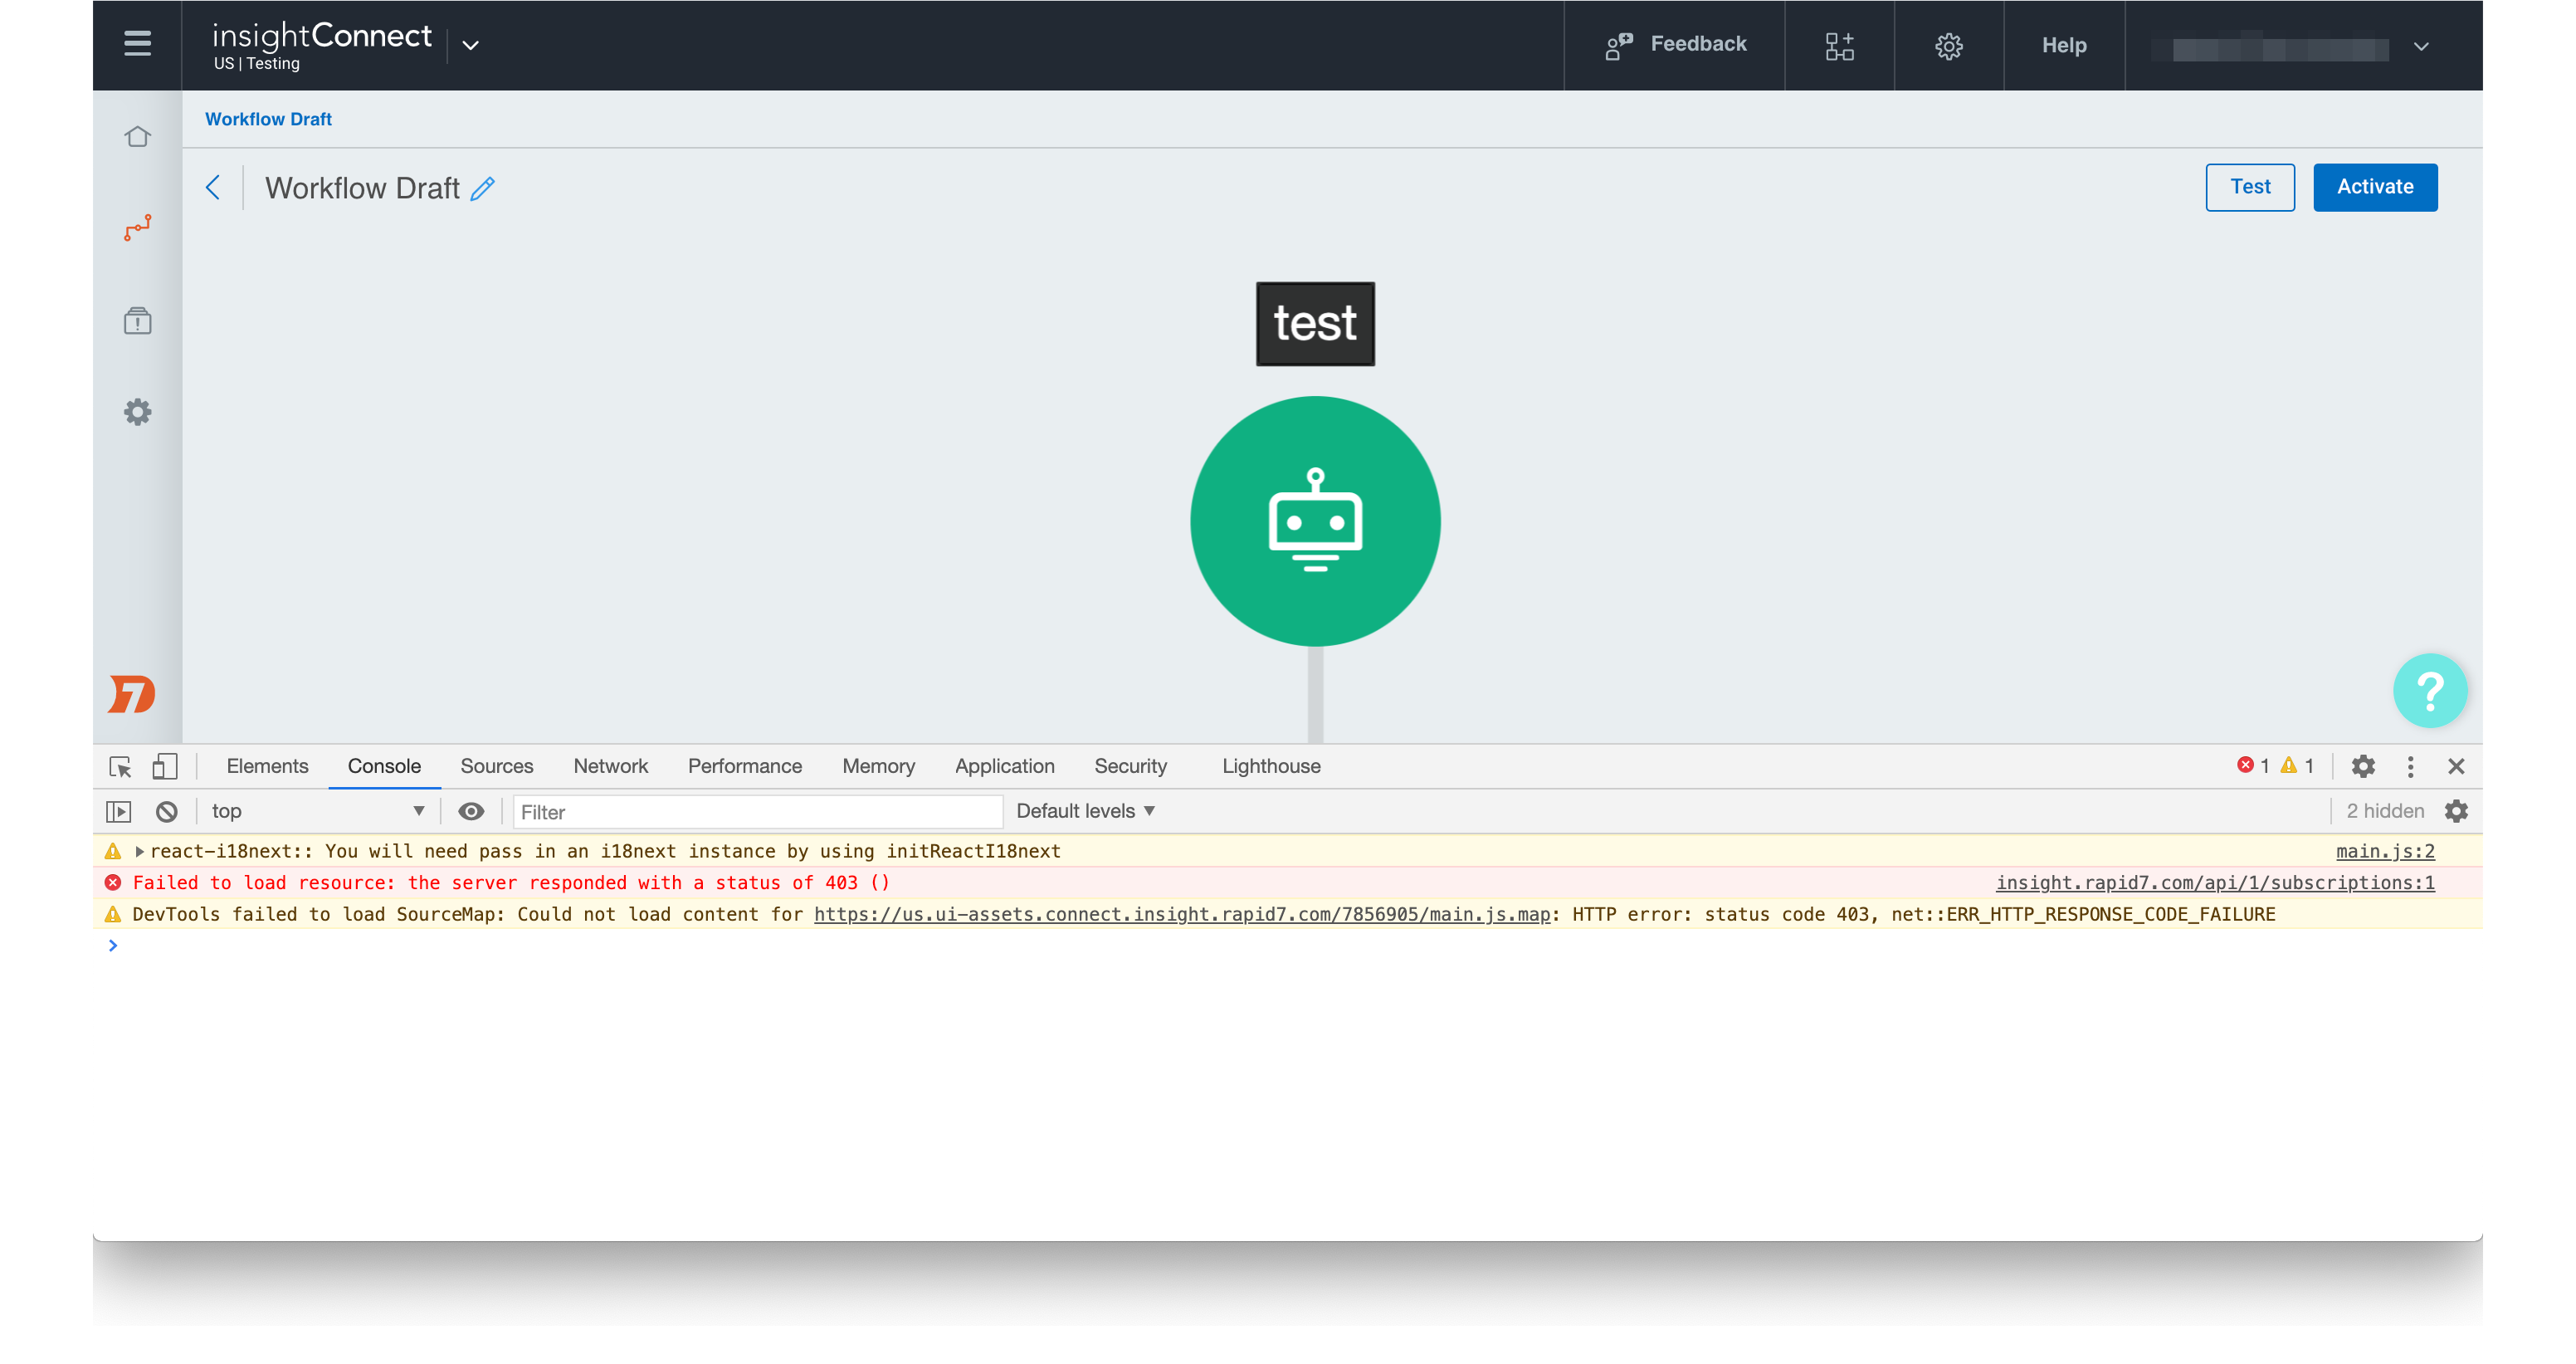
Bugs can happen in the UI and cause unexpected results or block your work. To check for bugs, open your browser’s developer tools to look for errors. If found, report them to the Automation (InsightConnect) team in Slack.
File Uploads
Testing file uploads via API trigger can be done with the following shell function:
$ declare -f postfile
postfile ()
{
    local var="$1";
    local file="$2";
    local url="$3";
    local token="$4";
    local argc="$#";
    [[ $argc -ne 4 ]] && {
        printf "postfile <var> <path/file> <url> <key>\n" && return 0
    };
    b64=$(base64 ${file});
    json=$(echo -n '{'\""${var}"\"': '\""${b64}"\"'}');
    echo $json | eval curl -H \"Authorization: $token\" -H \"Content-Type: application/json\" -d @- $url
}
Usage, where < var > is the name of the API trigger variable for which the file will be the value (script only supports one currently):
$ postfile
postfile <var> <path/file> <url> <key>
Example:
$ postfile pcap ~/google-http.pcap http://127.0.0.1:8888/v2/workflows/6535b9ba-1930-4c56-a5e2-1904b048a4ee/events bae09ddd-a593-4113-96a6-7cedb816cf1a