Planning for capacity requirements
Capacity planning is the process of determining the resources needed by an application over time by identifying current usage trends and analyzing growth patterns. As usage grows, the main challenge is to ensure that system performance is consistent over long periods of time and the system has enough resources to handle the capacity for future needs. This document gives detailed information on the capacity usage patterns of the application based on intended usage, so that you can plan, analyze, and address capacity issues and allocate resources as needed to support your expected use.
The approach is first to analyze the current capacity under certain conditions such as numbers of assets, number of scans performed, and the frequency and number of reports that are generated and then to plan for future capacity needs. Tests were completed with a wide variety of individual assets in order to accurately capture the impact that different types of assets have on scan time, network utilization, and disk usage. The results of these tests were then used to create formulas that you can use to predict capacity needs for various usage scenarios. These formulas were then tested with real-world scanning scenarios to get repeatable, empirical measurements of disk usage, scan duration, and network utilization.
What size console do I need for my deployment?
The console size needed for deployment depends on your scanning needs. See the System Requirements page for recommendations.
How long will it take to scan an average asset?
Scan duration will vary based on operating system installed, responsiveness of the asset, open ports, applications installed, services running, and patch levels. These variables, in addition to scan configuration and network conditions, affect the scan duration and disk usage needs.
Below is a summary of average scan duration and disk usage when using the Full Audit template across a /20 network range where ~1,000 assets are alive. We will use these values in later calculations when determining total scan duration based on number of assets, engines and threads.
| Type of scan | Vulns per asset | Average Asset Scan Duration | Average Asset Disk Usage |
|---|---|---|---|
| Unauthenticated | 18 | 3.5 minutes (range 12 s – 29 min) | 37 KB |
| Authenticated | 307 | 7.4 minutes (range 12 s – 38 min) | 422 KB |
The test results indicate that authenticated scanning can take about twice as long as unauthenticated scanning due to the increase in the amount of local software that is assessed when having access to the asset.
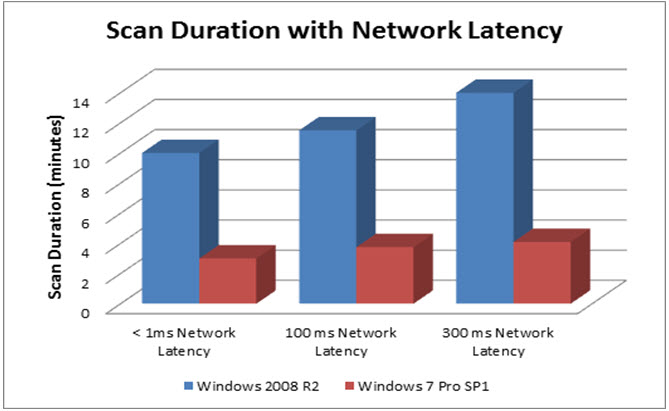
How does network latency affect scan duration?
Scan duration may vary based on network latency. The graph below shows the scan time for two sample assets when scanned for vulnerabilities (no policy checks were run) with credentials under different network latencies. In the capacity planning testing it was observed that network latencies of 100 ms increased scan times by 15-25% and network latencies of 300 ms increased scan times by around 35% for the assets tested. Actual impact may vary depending on the asset being scanned and the scan settings.
How much disk space will I need on my console?
We will use the following values for “Average Asset Disk Usage” that we collected earlier. Authenticated scanning will consume about 10 times the disk that unauthenticated scanning will consume. This is because authenticated scanning will evaluate vulnerabilities in local software packages and file shares that unauthenticated scanning will not evaluate.
| Type of Scan | Vulns Per Asset | Average Asset Scan Duration | Average Asset Disk Usage |
|---|---|---|---|
| Unauthenticated | 18 | 3.5 minutes | 37 KB |
| Authenticated | 307 | 7.4 minutes (range 12 s – 38 min) | 422 KB |
Reports that summarize trends or remediation information use much less disk space than those reports and export formats that export all asset and vulnerability information. Therefore, to determine disk usage by reporting, a CSV export of all fields across the ~1,000 assets tested was created in order to calculate the disk usage per asset that was consumed for authenticated and unauthenticated scans. This would represent retrieving all data out of the system after every scan.
| Type of Scan | Average Vulns | Report Template | Average Asset Disk Usage |
|---|---|---|---|
| Unauthenticated | 18 | CSV Export – All Fields | 52 KB |
| Authenticated | 307 | CSV Export – All Fields | 703 KB |
Here is the formula to calculate the total disk usage based on number of scans, number of reports, and the number of assets scanned and reported:
Total Disk SpaceRequired = (K x NumberOfAssets x NumberOfScans)
- (L x NumberOfAssets x NumberOfScans x NumberOfReportsGenerated)
- M
where K = disk usage of one scan of one asset, L = disk usage of for reporting on an asset, and M = the base install of the application. The values can be pulled from our test data for authenticated and unauthenticated scans:
| Parameter | Unauthenticated Scan | Authenticated Scan |
|---|---|---|
| K | 37 KB | 422 KB |
| L | 52 KB | 703 KB |
| M | 2,500 MB | 2,500 MB |
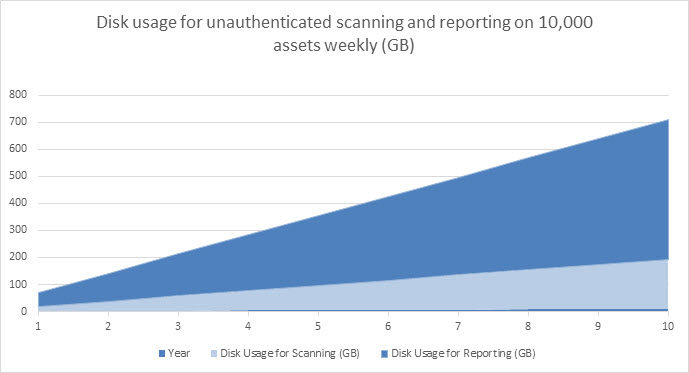
Now we can calculate the total disk usage over time. Total disk space required for unauthenticated scanning of 10,000 assets weekly for one year and generating two reports, CSV Export of all fields and a Top Remediations with Details report, every week:
= (0.037 x 10,000 x 52) + (0.052 x 10,000 x 2 x 52) + 2,500 MB
= 75,820 MB (~76 GB)
The following chart illustrates disk usage over time for reporting and unauthenticated scanning 10,000 assets weekly and generating two reports per scan:
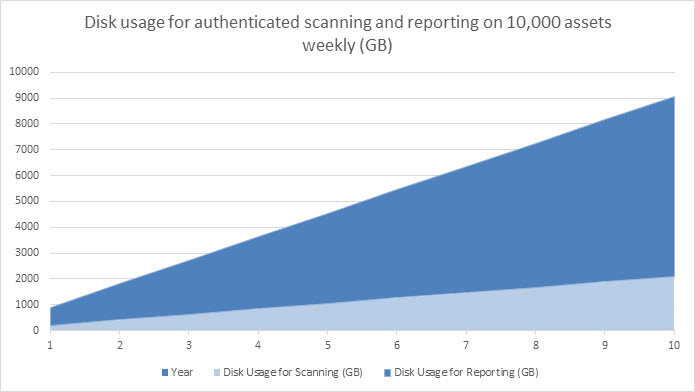
Total disk space required for authenticated scanning of 10,000 assets weekly for one year and generating two reports, CSV Export and Remediation Plan, every week:
= (.422 x 10,000 x 52) + (.703 x 10,000 x 2 x 52) + 2,500 MB
= 953,060 MB (~.95 TB)
In order to ensure the proper disk capacity, set the proper data retention policy by reading the “Setting data retention preferences” section.
How many assets can a Scan Engine handle?
Real world scanning throughput will depend on the network conditions, the average asset scan times, and scheduling. If a given engine is handling concurrent scans, keep in mind that the number of threads will also increase. For example, if an 8 GB engine is assigned to two sites and scanning 1,000 assets in each site with a scan template that scans 100 assets concurrently, then the concurrent assets would effectively be 200 and you probably want to change the schedule or increase the memory or reduce the number of concurrent assets. Note that the number of concurrent assets to scan is set on the Scan Template Configuration page using the Maximum assets scanned simultaneously per Scan Engine option on the General tab. To learn more, see the Tune section.
This table provides best practice guidelines on what the Maximum assets scanned simultaneously per Scan Engine can be set to, based on engine resources. The more resources the engine has, the more assets can be scanned in a single day.
| Engine Type | 8 GB / 2 cores | 16 GB / 4 cores | 32 GB / 8 cores |
|---|---|---|---|
| Windows Dedicated Scan Engine | 150 | 300 | 700 |
| Windows Console Local Scan Engine | 50 | 150 | 300 |
| Linux Dedicated Scan Engine | 200 | 400 | 800 |
| Linux Console Local Scan Engine | 75 | 200 | 400 |
How long will it take to scan X assets with Y engines?
Scan duration depends on number of assets to be scanned, the average asset scan duration, the number of Scan Engines being used, and the number of scan threads used on the scan template. Scan duration decreases as the number of Scan Engines and number of scan threads increases for a fixed number of assets. There is some additional overhead to adding engines due to the remote communication required to retrieve the result; however, adding scan engines is the best way to horizontally scale up the scanning ability to larger numbers of assets in shorter periods of time.
The following formula calculates estimated scan duration based on number of assets, average scan time per asset, number of scan threads and number of scan engines. Note that the network configuration is also an important factor in number of scan engines needed. For example, if assets are spread across 4 VLANS without connectivity between them, one scan engine will be required per VLAN to be able to scan assets in that VLAN.

The 1.2 value above represents the overhead of integrating scan results into the console. The .85 represents the overhead of managing additional scan engines. Both values are conservative estimates and may vary based on the console’s specifications and configuration. The lower bound on both of these formulas will always be the longest asset scan duration. For example, if there is one asset that takes thirty minutes to scan then the total scan time for all assets will never be less than thirty minutes.
Here is an example of using 100 threads to scan 10,000 assets with an average asset scan duration of 3.5 minutes:
= (1.2 x 3.5 min x 10,000)/100 = 420 minutes = 7 hours
The total time to perform an authenticated scan of 10,000 assets with one Scan Engine would be the following:
= (1.2 x 3.5 min x 10,000)/(.85 x 4 x 100)= 123 minutes = ~2 hours
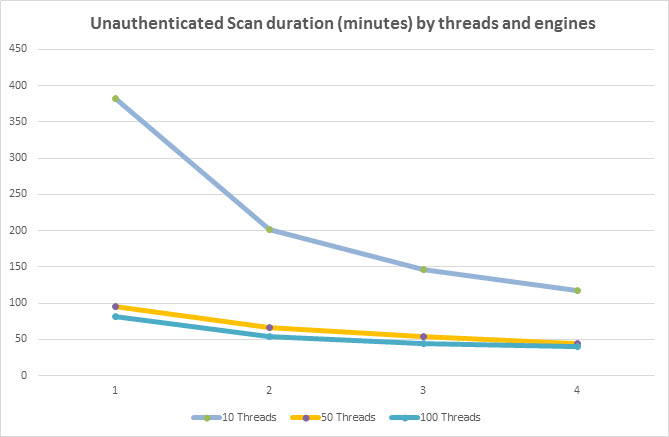
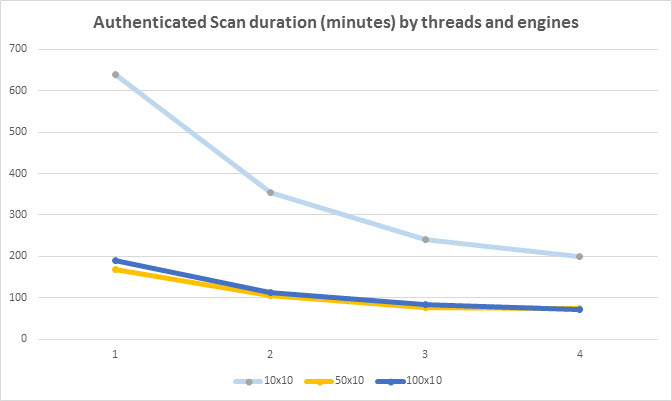
This chart shows the effect on scan duration when using different amounts of threads and engines. As you can see, increasing thread count per engine is more effective than adding engines. However, each engine can only handle a certain amount of threads before memory or CPU contention becomes a bottleneck and adding more threads or engines does not help significantly. Therefore, you should maximize the number of threads per engine before scaling out to multiple engines in order to have the most impact on scan duration.
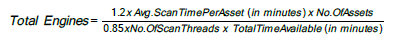
How many engines do I need to scan X assets in Y hours?
The same formula can be used to calculate number of Scan Engines needed as well. For example, if 10,000 assets need to be scanned in 4 hours then the following will calculate the number of engines needed:
For unauthenticated scanning with 100 threads with average asset scan time of 3.5 minutes:
= (1.2 x 3.5 min x 10,000)/(.85 x 100 x 240) = ~2 engines required
For authenticated scanning with 100 threads we change the average asset scan time to 7.4 minutes:
= (1.2 x 7.4 min x 10,000)/(.85 x 100 x 240) = ~4 engines required
Please note that the number of engines required may be determined by the scan templates used and the accessibility of scan targets within the network topology. The formula above is to be used for guidance in determining the number of engines needed for sheer throughput and assumes the engines have access to all the assets being scanned and that assets can be equally distributed across sites.
How much network bandwidth will be used when scanning?
As the application scans assets over the network, a considerable amount of network resources may be consumed. The amount of network bandwidth used is directly proportional to number of devices being scanned simultaneously, the type of assets being scanned, and the scan template settings. This section provides capacity guidelines of network utilization when assets over the network were being scanned so that administrators can adjust their scan windows and scan template settings to not affect other critical network traffic or affect accuracy of scan results.
The following graph represents the network utilization with different number of assets in one site, keeping number of scan threads constant (20) number of scan ports constant (20) and performing unauthenticated scans:
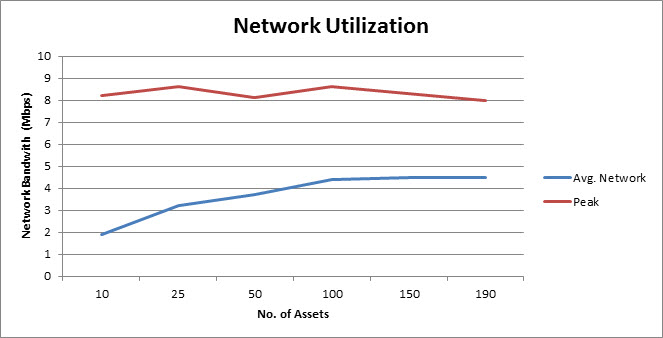
The network utilization would remain constant after a certain number of assets, because the upper bound is determined by the total number of scan threads defined in the scan template.
The more simultaneous scans are performed the more network bandwidth would be consumed up to a certain point. The below graph shows the network bandwidth consumption in two different scan scenarios performed on fixed number of assets
- Scenario 1: One site - 20 Threads configured - Unauthenticated Scan
- Scenario 2: Two Sites - 20 Threads configured (each) - Unauthenticated Scan
- Scenario 3: Three Sites - 20 Threads configured (each) - Unauthenticated Scan
The following graph shows the comparative network utilization based on these three scenarios:
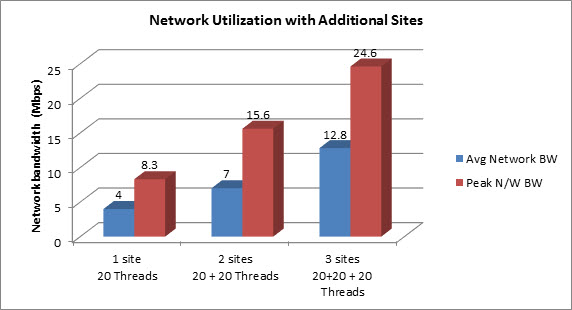
When simultaneous scans are performed with additional sites, scan duration would come down but at the expense of in network bandwidth and CPU utilization.
Peak Network Bandwidth (Mbps) = 0.4_x No.OfAssetsScanned Simultaneously_ AverageNetwork Bandwidth (Mbps) = 0.45_x PeakNetworkBandwidth_
How can I tune the application for maximum scanning throughput?
Tuning the database server for maximum performance
The application comes with a PostgreSQL database server installed which can be tuned for better performance based on the amount of RAM available to the console host. Tuning PostgreSQL will improve integration times which will reduce overall scan duration. See Tuned PostgreSQL settings for more information on how to tune the database.
Tuning scan templates for maximum performance
Scan templates have a wide variety of options which can be adjusted to deliver greater throughput when scanning. One of the most effective tuning options is to increase the number of scan threads from the default value by setting Maximum assets scanned simultaneously per Scan Engine on the General tab of the Scan Template Configuration page. When scanning assets that have a lot of open services, increase the value of Maximum scan processes simultaneously used on each asset to decrease scan duration. To decrease the duration spent during asset discovery, increase the minimum value for Packets-per-Second Rate on the Discovery Performance tab of the scan template. Increasing the minimum can greatly improve discovery performance and comes at the cost of additional bandwidth usage so be aware of the demands on the network when increasing this value.
See Scan template best practices for information on how to tune templates for maximum performance.
Scaling with multiple Scan Engines
As seen by the Scan Engine performance section, multiple engines can provide greater throughput for scanning and enables deployments to horizontally scale to large numbers of assets. Before scaling to multiple engines, increase the number of threads used in order to maximize the hardware resources available on each engine. Since the console is responsible for generating reports, integrating scan results, and serving up content for end users, it is highly recommended to delegate scanning to remote engines when scanning more than a few hundred assets.
Scaling with multiple Security Consoles
Multiple consoles can also be deployed in situations where regional areas have their own scanning and reporting needs. Adding additional consoles enabled horizontal scaling of the reporting, user interface, and integration resources. For more information, see Where to put the Security Console.