Site Detail View
You can open a site’s detail view by clicking on the name link of any site in your “Sites” table from the Home tab of the Security Console. Site detail views contain a variety of site data points and functions. This article explains the contents of each site detail view dashboard item.
Site Scan Summary
This dashboard item displays several asset and vulnerability metrics, as well as the last scan date and the next scheduled scan, if applicable. Click the date link under “Last Scanned” to navigate directly to that scan detail page.
The aforementioned asset metrics are defined in the following ways:
- Defined Assets - The number of unique IPs or hostnames defined in the “Site Configuration” screen.
- Active Assets - The number of assets found in the latest scan of the site.
- Inactive Assets - The difference between how many assets were found in the most recent scan of the site and how many assets exist in the site in total.
NOTE
The number shown for “Defined Assets” only indicates the total number of possible asset targets according to your site configuration. This figure can be skewed if your site configuration uses address ranges that encompass many unique IPs. It is not uncommon for the sum of your “Active Assets” and “Inactive Assets” to be far lower than your number of “Defined Assets”.
The Site Scan Summary dashboard item also features these quick functions:
- Manage Site - Click this button to navigate directly to the “Site Configuration” screen to perform any edits.
- Create Site Report - Click this button to navigate directly to the Reports tab. A prenamed report of the Audit Report template will be scoped according your site and ready for generation.
- View Scan History - Click this button to see any ongoing scans and all past scans for your site.
Trends
In the same fashion as the network-wide Risk and Assets Over Time chart on your Security Console Home tab, this chart can give you a general idea of how your risk is being managed over time relative to the number of assets in your site. You can also adjust this chart to a Vulnerabilities Over Time variant.
Assets by Risk and Vulnerabilities
This color-coded scatter plot gives you a general idea of both risk and vulnerability count per asset for your selected site. Each asset in your site is plotted by the number of vulnerabilities found and its resulting risk calculation. Asset plots darken from yellow to red as their risk increases.
Current Scans
This table will indicate any ongoing scans for your selected site. If no scan is currently running, you can manually initiate one by clicking Scan Now.
Assets
This table lists all assets included in your selected site along with overview information for each, including its IP address, vulnerabilities, risk, and last scan date. Click any address or name link to view that asset in detail.
Last Scan Time vs. Last Scan
The Last Scan seen on the Sites detail page or Assets refers to the last time a discovery, vulnerability, or policy scan was run. The Last Scan Time column available in the Query Builder or Dashboard cards specifically refers to the last time the asset was assessed by an agent.
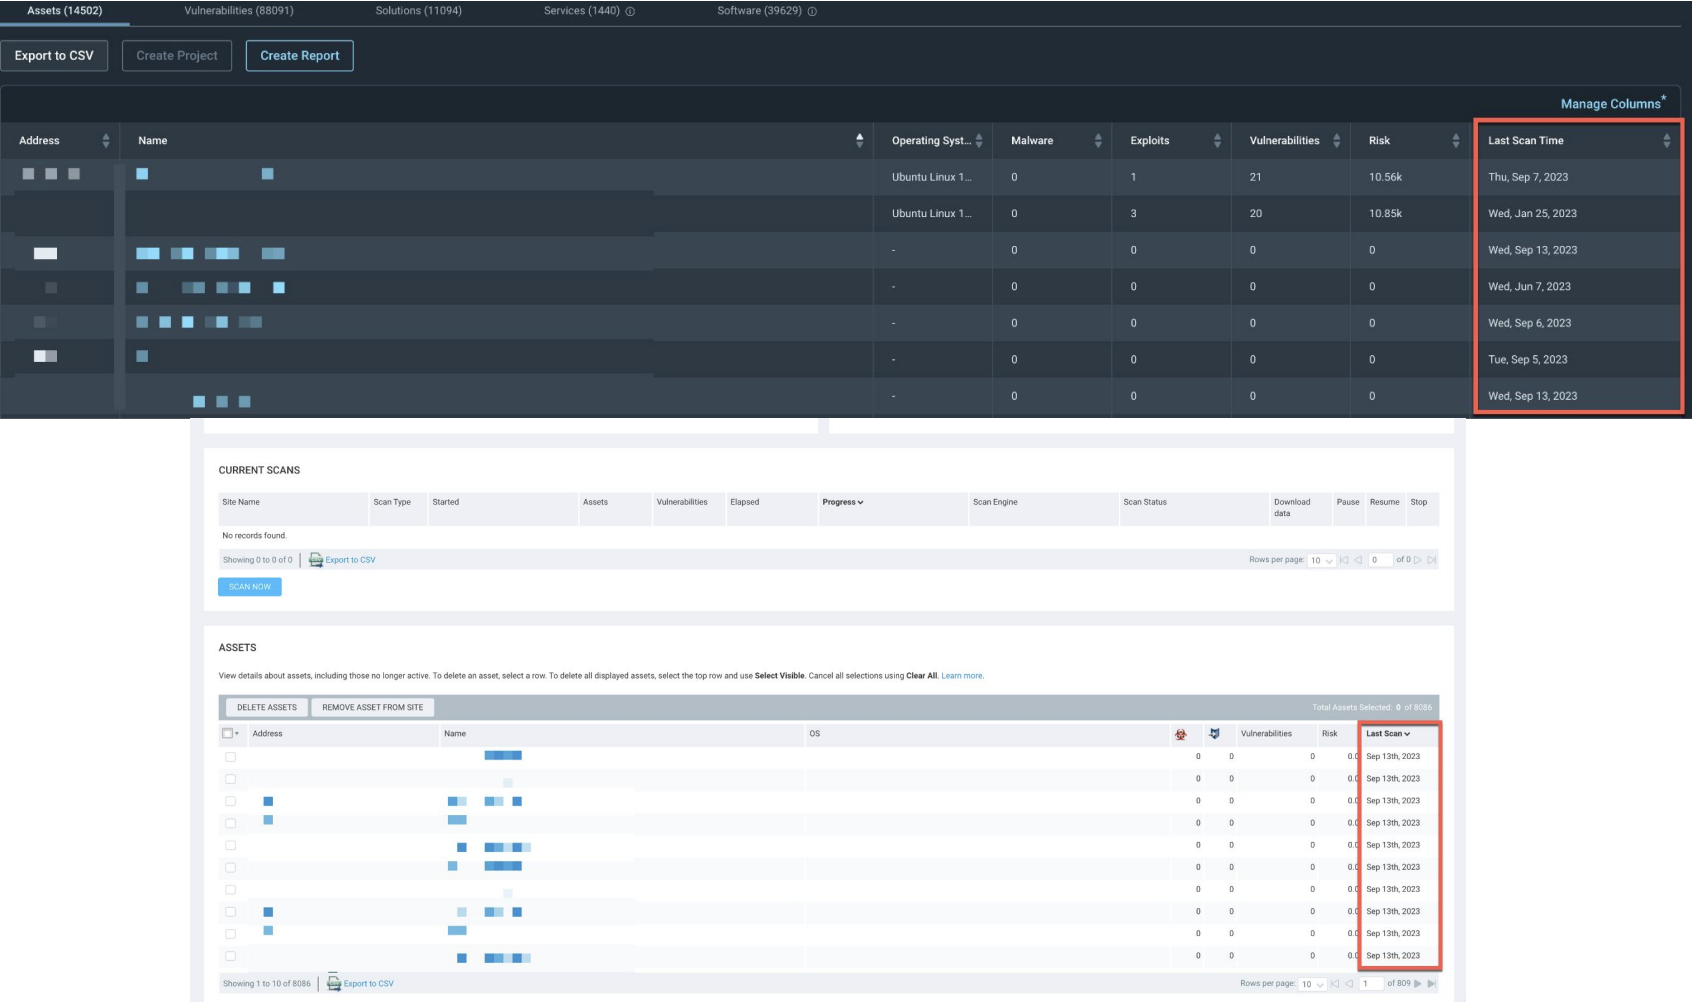
You can modify which assets are included in the site by checking their respective boxes and using one of the following functions:
- Delete Assets - Globally removes the asset from your current site and any other sites where it may be included.
- Remove Asset From Site - Removes the asset from your selected site only.
TIP
Both these asset removal options are “soft” deletes, meaning that assets deleted in this way are only removed from your asset and site tables. Historical trend data in your Security Console will remain unchanged.