Vulnerability Management (InsightVM) Quick Start Guide
This quick start guide is designed to get you up and running with the Security Console in as little time as possible.
We’ll guide you through the first 90 days, providing assistance with:
- Days 1-15: Installing and activating the console, pairing the console to the platform, pairing the console to a scan engine, creating, and scanning a site.
- Days 16-45: Creating a set of shared credentials, scheduling a scan, deploying an Rapid7 Agent (Insight Agent) (optional), creating a report, and customizing a dashboard.
- Days 46-90: Tagging and grouping assets, scheduling a report, setting up goals/SLAs, and remediating vulnerabilities.
- Days 90+: Providing additional resources to help you to scale your security program and customize to your needs.
Benefits of the Security Console
In short, the Security Console is an on-premises vulnerability scanner and management system. Its core features allow you to identify risk in your environment, organize your devices, and prioritize remediation.
Scanning
Run scans to extensively probe your devices for known vulnerabilities, exploits, and policy rules. Create sites to logically group your assets for targeted scans. The Security Console uses Scan Engines to perform the actual scan job, and you can configure/distribute them in a way that is best for your environment. Choose between several built-in Scan Templates (such as CIS policy compliance or Full audit without Web Spider) to determine which checks are performed for a particular scan. You can also tailor your own Scan Templates to quickly search for the vulnerabilities and policies that matter the most to your organization. Create scan schedules to automate your scan jobs and keep your security team informed on a regular basis.
Asset organization
Organize your scanned assets into dynamic or static asset groups according to a variety of traits, such as location, operating system, and owner. Use the Security Console’s tagging system to adjust risk scores and prioritize remediation for your most critical assets. Run filtered asset searches to find scanned assets based on over 40 unique parameters.
Reporting
Generate reports of your scan results so your security teams know what to fix and how. Make use of our built-in report templates or leverage SQL query exports for fully customizable reports. The following example cases highlight some of our most popular report templates:
- Leverage the Top Remediation report to prioritize the remediations that lead to the greatest reduction in risk.
- If you’re a business that handles credit card transactions, use the PCI report to prepare for an upcoming PCI audit.
- Generate the Vulnerability Trends report to examine your total detected assets, vulnerabilities, and exploits over custom date ranges.
Advanced features
Vulnerability Management (InsightVM) offers far more advanced functionality than we can cover in the scope of this guide, but we can talk about those features later. For now, just keep these core features in mind as they are the tools you’ll be using day to day.
Core Components
Your Vulnerability Management (InsightVM) installation has the following components:
| Component | Description |
|---|---|
| Security Console | This is the component you’ll use to create sites, run scans, generate reports, and much more. The Security Console is accessed via a web-based user interface through any of our supported browsers. |
| PostgreSQL database | The embedded PostgreSQL database stores all the asset scan data and is used for generating reports. |
| Scan Engine | Scan Engines are responsible for performing scan jobs on your assets. Note that Scan Engines only store scan data temporarily before sending it back to the Security Console for integration and long-term storage. |
Requirements
Before you start, ensure you have the following in place.
System requirements
The following system requirements are necessary to ensure you have the best experience.
Hardware requirements
The Security Console requires significantly more system resources than a Scan Engine, as it includes a web interface, PostgreSQL database, and reporting capabilities.
Containers:
- Security Console: Not supported in a containerized environment.
- Scan Engine: Available as a container image on Docker Hub .
Virtual Machines:
When deploying the Security Console on a virtual machine (VM):
- Memory reservation must match allocation. For example, if you allocate 32 GB of RAM, you must also reserve 32 GB.
- Avoid using shared memory configurations, which can lead to:
- Degraded performance
- Out-of-memory (OOM) errors
Security Console Minimum Specifications:
At this time, we only support x86_64 architecture.
| Asset Volume | CPU Cores | Memory | Storage |
|---|---|---|---|
| 5,000 | 4 | 16 GB | 1 TB |
| 20,000 | 12 | 64 GB | 2 TB |
| 150,000 | 12 | 128 GB | 4 TB |
| 400,000 | 12 | 256 GB | 8 TB |
Scan Engine Minimum Specifications: Several factors can affect memory consumption during scans, including the type of scan being conducted (for example, Policy, Vulnerability, or Discovery), the number of ports detected that require fingerprinting, and the configured Maximum assets scanned simultaneously per Scan Engine. Additionally, the operating system on which the scan engine application is installed can influence memory usage; for example, a Windows server may use more memory compared to a Linux server.
| Processor | Memory | Storage |
|---|---|---|
| 4 cores | 16 GB | 200 GB |
Operating Systems
We require an English operating system with English/United States regional settings.
64-bit versions of the following platforms are supported:
| Vendor Platform | OS | Vendor Standard EOL | Vendor Extended EOL | Rapid7 Support EOL |
|---|---|---|---|---|
| Linux | Ubuntu Linux 24.04 | April 1, 2029 | April 1, 2034 | April 1, 2034 |
| Ubuntu Linux 22.04 | April 1, 2027 | April 1, 2032 | April 1, 2032 | |
| Ubuntu Linux 20.04 | May 1, 2025 | April 1, 2030 | April 1, 2030 | |
| Ubuntu Linux 18.04 | May 1, 2023 | April 1, 2028 | April 1, 2028 | |
| Ubuntu Linux 16.04 | April 1, 2021 | April 1, 2026 | April 1, 2026 | |
| Oracle Linux 8 | July 1, 2029 | July 1, 2032 | July 1, 2032 | |
| Oracle Linux 7 | December 1, 2024 | June 1, 2028 | June 1, 2028 | |
| SUSE Linux Enterprise Server 12 | October 31, 2024 | October 31, 2030 | October 1, 2030 | |
| SUSE Linux Enterprise Server 15 | July 31, 2031 | July 31, 2037 | July 31, 2037 | |
| Alma Linux 9 | May 31, 2027 | May 31, 2032 | May 31, 2032 | |
| Rocky Linux 9 | May 31, 2027 | May 31, 2032 | May 31, 2032 | |
| Microsoft Windows | Microsoft Windows Server 2022 | October 13, 2026 | October 14, 2031 | October 14, 2031 |
| Microsoft Windows Server 2019 | January 9, 2024 | January 9, 2029 | January 9, 2029 | |
| Microsoft Windows Server 2016 | January 11, 2022 | January 12, 2027 | January 12, 2027 | |
| Red Hat | Red Hat Enterprise Linux Server 9 | May 31, 2027 | May 31, 2035 | May 31, 2035 |
| Red Hat Enterprise Linux Server 8 | May 31, 2024 | May 31, 2032 | May 31, 2032 | |
| Red Hat Enterprise Linux Server 7 | August 6, 2019 | June 30, 2028 | June 30, 2028 |
For a limited time, Rapid7 will provide support for existing customers on 64-bit versions of the following platforms:
| Vendor Platform | OS | Vendor Standard EOL | Vendor Extended EOL | Rapid7 Support EOL |
|---|---|---|---|---|
| Microsoft Windows | Microsoft Windows Server 2012 R2 | October 9, 2018 | October 10, 2023 | January 2, 2026 |
| Microsoft Windows 8.1 | January 9, 2018 | January 10, 2023 | January 2, 2026 | |
| Red Hat | Red Hat Enterprise Linux Server 6 | May 10, 2016 | June 30, 2024 | January 2, 2026 |
| CentOS | CentOS¹ | 7 August 6, 2020 | June 30, 2024 | January 2, 2026 |
¹ CentOS 7 has reached end-of-life, and no future versions of the CentOS Linux distribution are planned. To maintain compatibility, receive security updates, and ensure full support, migrate to a supported operating system from Rapid7’s approved list.
Browsers
We support the most recent version of the following browsers:
- Google Chrome (Recommended)
- Mozilla Firefox
- Mozilla Firefox ESR
- Microsoft Edge
Firewall requirements
InsightGovCloud has additional firewall rules
If you are an InsightGovCloud customer, you must also implement the firewall rules in the prerequisite section of the Deploy Vulnerability Management in InsightGovCloud topic .
Security Console firewall requirements:
You must configure your firewall rules to allow outbound connectivity using Port 443. This ensures you can successfully upload data from the Security Console to the Command Platform (Insight Platform).
| Region | Region URL | S3 (Agent Downloads only) |
|---|---|---|
| United States - 1 | us.api.endpoint.ingress.rapid7.com us.deployment.endpoint.ingress.rapid7.com exposure-analytics.insight.rapid7.com | s3.amazonaws.com |
| United States - 2 | us2.api.endpoint.ingress.rapid7.com us2.deployment.endpoint.ingress.rapid7.com us2.exposure-analytics.insight.rapid7.com | s3.us-east-2.amazonaws.com |
| United States - 3 | us3.api.endpoint.ingress.rapid7.com us3.deployment.endpoint.ingress.rapid7.com us3.exposure-analytics.insight.rapid7.com | s3.us-west-2.amazonaws.com |
| Europe | eu.api.endpoint.ingress.rapid7.com eu.deployment.endpoint.ingress.rapid7.com eu.exposure-analytics.insight.rapid7.com | s3.eu-central-1.amazonaws.com |
| Canada | ca.api.endpoint.ingress.rapid7.com ca.deployment.endpoint.ingress.rapid7.com ca.exposure-analytics.insight.rapid7.com | s3.ca-central-1.amazonaws.com |
| Japan | ap.api.endpoint.ingress.rapid7.com ap.deployment.endpoint.ingress.rapid7.com ap.exposure-analytics.insight.rapid7.com | s3-ap-northeast-1.amazonaws.com s3.ap-northeast-1.amazonaws.com |
| Australia | au.api.endpoint.ingress.rapid7.com au.deployment.endpoint.ingress.rapid7.com au.exposure-analytics.insight.rapid7.com | s3-ap-southeast-2.amazonaws.com s3.ap-southeast-2.amazonaws.com |
For additional IP addresses for each region see Connectivity requirements.
You must also allow the Security Console to make outbound connections to updates.rapid7.com on Port 443. The Security Console connects to updates.rapid7.com regularly to check for new product versions (every 6 hours) and vulnerability/policy content (every 2 hours). With every connection, the console uploads a JSON file containing license and usage information that helps Rapid7 understand how the Security Console is being used. This upload does not contain any vulnerability assessment data from your assets or any other sensitive information on your environment.
Scan Engine firewall requirements:
If firewalls are present on your network, make sure you whitelist the necessary ports for your Security Console and Scan Engine host according to the communication method of your choice. Consult the following table for port whitelist requirements.
| Source | Destination | Port | Protocol | |
|---|---|---|---|---|
| Console-to-Engine | Console | Scan Engine | 40814 | TCP |
| Engine-to-Console | Engine | Console | 40815 | TCP |
Ports
The ports shown in this table are the default ports used by the Security Console and Scan Engine. If you modify these default ports during the deployment procedure, make sure your firewall rules match your port modifications.
System requirement consideration
Memory
The integration of scan data from Scan Engines can be memory-intensive depending on how many assets are being scanned at once. For this basic deployment, your host machine must have a minimum of 16GB RAM.
Disk space
Proper disk space allocation for the database is essential. The biggest storage impact on your host machine will come from scans, reports, and database backups. Scan data alone can have varying levels of storage impact depending on your configuration, including scan frequency and whether or not you are authenticating to the target assets.
Note
Authenticated scans require roughly ten times the disk space of unauthenticated scans.
For this basic deployment, your host machine must have a minimum of 100GB of free storage space in order to accommodate your future scan data and reports. At least 1TB of free storage space is recommended for small-scale deployments.
Consider this example deployment situation: Scanning 1000 assets on a monthly basis with authentication, generating a single report, and storing the data for one year will take 76GB of storage.
Don’t underestimate your storage needs
As you prepare your deployment plan, think about how your network and security needs could change over time. Allocate free storage so you can scan additional assets, increase your scanning frequency, and create database backups. Your Security Console host should be prepared for these events! If you find yourself making a decision between two numbers, go for the larger one.
Check our System Requirements page for details. Note the supported operating systems and browsers in particular. Also, you can run the Security Console and Scan Engine on a virtualized instance of any of our supported operating systems as long as they meet the system requirements.
You can deploy using Ubuntu Linux or Windows.
Network requirements
Host IP address
The IP address of your host machine must be statically assigned. You will use this address to access the Security Console’s web interface.
Ports
InsightGovCloud requires additional ports to be configured
If you are an InsightGovCloud customer, you must also open the ports in the prerequisites section of the Deploy Vulnerability Management in InsightGovCloud topic .
The Security Console communicates through these ports in order to perform the following tasks:
| Port | Task | Direction | Destination |
|---|---|---|---|
| 3780 (HTTPS protocol) | Web interface access to the Security Console | Inbound | Security Console |
| 40814 | Management of scan activity on Scan Engines and the retrieval of scan data | Outbound | Scan Engine |
| 443 | Upload of PGP-encrypted diagnostic information | Outbound | support.rapid7.com |
| 443 | Allows the Security Console to download content and feature updates. You must allow the server hosting Vulnerability Management (InsightVM) to make outbound connections to updates.rapid7.com on port 443. The Security Console connects to updates.rapid7.com regularly to check for new product versions (every 6 hours) and vulnerability/policy content (every 2 hours). With every connection, the console uploads a JSON file containing license and usage information that helps Rapid7 understand how Vulnerability Management (InsightVM) is being used. This upload does not contain any vulnerability assessment data from your assets or any other sensitive information on your environment. You can see the contents of this JSON file yourself by running the generate statistics command in the command console. | Outbound | updates.rapid7.com |
| 25, 465 (optional, feature-related) | If report distribution through an SMTP relay is enabled, the Security Console must be able to communicate through these channels to reach the relay server | Outbound | SMTP relay server |
Opt into the Command Platform (Insight Platform)
Vulnerability Management (InsightVM)’s platform-only features like Dashboards and Remediation Projects require some additional connectivity in order to function properly. See our communications page for detailed platform connectivity requirements.
Programs and services
Several programs and services must be disabled for the Security Console to function. In general, the following services may interfere with network scanning and may also prevent checks from loading or executing:
- Anti-virus / malware detectors: If disabling your anti-virus or malware detection software is not an option, make sure that you configure the software to bypass the Rapid7 installation directory on your Security Console host (the default location for this directory on Windows is
C:\Program Files\Rapid7). This ensures that Vulnerability Management (InsightVM) can operate without interference from this kind of software. - Intrusion Detection Systems (IDS)
- Personal firewalls
- Executable blocking products
- SELinux
Days 1-15: Build your Foundation
During your initial stages of onboarding, you will set up the foundational tools and features of InsightVM.
Within the first 15 days, you will:
- Install and activate the console
- Pair the console to the platform
- Deploy a scan engine
- Deploy an Rapid7 Agent (Insight Agent)
- Create a site
- Run your first scan
Installation Options
Default account creation
During your installation, you’ll create a default account with Global Administrator privileges. When you configure these credentials, store them in a safe place where you can reference them in the future.
Username and password creation.
Credentials are case-sensitive. As you create credentials, complexity requirements are displayed to ensure that your credentials are secure. Even if your password meets the minimum requirements, it is recommended that you make your password as strong as possible for additional security. A “heat bar” is displayed that gradually changes color from red to green as you make your password stronger. Global Administrators can create and modify accounts after installation.
Avoid conflicts with other authentication source accounts
As a general guideline, the username for your default account should be totally unique from any other account name that you may have already configured in other external authentication sources. The Security Console requires that all user accounts have unique usernames. If you intend to configure an external authentication source for console access (such as Active Directory or SAML), do not use one of your external authentication accounts as the default account username.
Recovery of credentials is not supported.
After installation is complete, you will be able to log in to the Vulnerability Management (InsightVM) application. Recovery of credentials is not supported. If you forget your username or password, you will have to reinstall the program.
Enable/disable initialization
Enabled by default, this option will initialize the Security Console after it’s been installed. Initialization configures the application for use and updates the vulnerability database. If you enable initialization, your installation time will increase respective to that process. Initialization time ranges from 10 to 30 minutes.
FIPS Mode requirements
While most organizations do not require this configuration, ensure that you DO NOT initialize the console during your installation if you intend to use FIPS mode. FIPS mode must be configured before the Security Console is started for the first time.
See Enabling FIPS mode for instructions.
Application initialization and automatic start option
If you are installing both the Scan Engine and the Security Console, the automatic start option is enabled by default. If you do not want automatic initialization to occur, you must disable it. The benefit to leaving this option enabled is that you can start using the Vulnerability Management (InsightVM) application immediately after the installation is complete. This is because it has to initialize before the process prepares the application for use by updating the database of vulnerability checks and performing the initial configuration. Leaving this option enabled increases total installation time by 10 to 30 minutes. Although disabling the option shortens the installation time, it takes longer to start the application because it will have to initialize before you can begin to use it.
Communication direction between console and engine
Your preferred communication direction between console and engine depends on network configuration:
- (Recommended) Engine to Console. The Scan Engine will actively inform the Security Console that it is available for communication. This configuration allows a configured console that is behind a firewall to allow inbound connections to establish a communication channel.
- Console to Engine. The Scan Engine will listen for communication from the security console. This configuration is most effective when the engine and console are on the same area of the network.
Download and install on Linux
Linux installation requirements
- The latest Linux installer .
- The corresponding checksum file for your installer, which helps ensure that installers are not corrupted during download.
- A product key, which is needed to activate your license upon login.
- Disable SELinux before you install the application.
- We recommend installing the tmux or screen package to provide an interactive terminal with the Security Console and Engine.
- Check the installer file to make sure it was not corrupted during the download.
- Uninstall any previously installed versions of InsightVM.
Contact your account representative if you are missing any of these items. You should have received an email containing the download links and product key if you purchased Vulnerability Management (InsightVM) or registered for an evaluation. We recommend adding Vulnerability Management (InsightVM) to your email client allowlist to ensure you are receiving all future emails regarding InsightVM.
Verify and Disable SELinux
If you intend to install the Security Console on a Linux host, you can verify whether or not SELinux is disabled, and take action to disable it if it isn’t, with the following procedure:
- Check the status of SELinux by opening its configuration file using a text editor of your choice. Enter the following command in a terminal:
vi /etc/selinux/config. - Navigate to the line beginning with
SELINUX=. If the value of this line shows enforcing, you will need to make an edit to disable SELinux. - To do so, modify the value of
SELINUX=from enforcing to disabled:SELINUX=disabled. - When finished, save and close the configuration file.
- Run the following command in your terminal to restart the Linux host so the changes can take effect:
shutdown -r now
- Download the latest Linux installer: Linux installer
- Use the following checksum file to verify the integrity of your installer and ensure that it wasn’t corrupted during the download process: sha512sum for Linux download
- Make sure your installer and checksum file are in the same directory.
- Open a terminal and browse to the directory where your installer and checksum file are located.
- Run the following command, substituting with the appropriate value:
sha512sum -c <installer_file_name>.sha512sum. Do not close command line window. A command line window will appear during installation. You do not need to interact with it, but do not close this window. - If this command returns an OK message, the file is valid. If the check fails, the file was found to be invalid. Download the installer again and retry.
- Modify the permissions of the installer to make it executable:
chmod +x <installer_file_name>.bin - Run the installer:
./<installer_file_name> -c - Follow the instructions prompted by the installer.
Using a GUI?
If you are using a Graphical User Interface, omit the -c switch at the end of the installer run command. You’ll use a wizard similar to the Windows version instead.
(Optional) Enable FIPS mode
If you want to enable FIPS mode, do not select the option to initialize the application after installation. FIPS mode must be enabled before the application runs for the first time.
Install the Local Scan Engine
If you are only installing the Scan Engine, you may need to specify the Shared Secret to pair it with a Security Console. Global Administrators can generate a Shared Secret in the Administration section of the Security Console. Select Manage scan engines, click Generate next to Shared Secret, and copy and paste the Shared Secret into the Installation Wizard.
Download and install on Windows
Windows installation requirements
- The Windows installer .
- The corresponding checksum file for your installer, which helps ensure that installers are not corrupted during download: sha512sum for Windows download
- A product key, which is needed to activate your license upon login.
- You have administrator privileges and are logged onto Windows as an administrator.
- Your system meets the minimum installation requirements.
- You have uninstalled any previously installed copies of the application.
Contact your account representative if you are missing any of these items. You should have received an email containing the download links and product key if you purchased Vulnerability Management (InsightVM) or registered for an evaluation. We recommend adding InsightVM.
- Download the latest installer Windows installer
- Use the following checksum files to verify the integrity of your installer and ensure that it wasn’t corrupted during the download process: sha512sum for Windows download
- Make sure your installer and checksum file are in the same directory.
- Open a command prompt and browse to the directory where your installer and checksum are located.
- Run the following command, substituting with the appropriate value:
certutil -hashfile <installer_file_name> sha512 - Run the installer. Do not close command line window A command line window will appear during the installation, but you will not need to interact with it. Do not close this window.
- Double-click the installer icon. A message displays while the wizard is preparing. Once the wizard is done preparing, you will be sent to the Welcome page to begin installation.
- Follow the steps as the wizard guides you. This is where you will decide on the considerations mentioned previously throughout the process.
(Optional) Enable FIPS mode
If you want to enable FIPS mode, do not select the option to initialize the application after installation. FIPS mode must be enabled before the application runs for the first time.
Install the Local Scan Engine
If you are only installing the Scan Engine, you may need to specify the Shared Secret to pair it with a Security Console. Global Administrators can generate a Shared Secret in the Administration section of the Security Console. Select Manage scan engines next under Scans, click Generate next to Shared Secret, and copy and paste the Shared Secret into the Installation Wizard.
Log in and activate
Initialization progress
If you just started to initialize after installation, it may still be in progress when you connect to the Security Console. You must wait for this process to complete before you can log in.
- Open your supported browser and connect to the following address, substituting
<console_address>with the FQDN or IP address of the machine where your Security Console is installed:https://<console_address>:3780 - A login prompt will display. Enter the credentials that you set up during the Security Console installation and click LOG ON.
- After you log in successfully, an activation prompt will appear. Enter your activation key in the provided field to activate.
Accessing the Security Console from the same machine that it's installed on?
In this case, you can quickly access the web interface by connecting to https://localhost:3780.
Get familiar with the console
Familiarize yourself with the Security Console Home page and get an introduction to some of the features you’ll use on a regular basis. This section covers some initial functions, display objects, navigation, and quick links to features, settings, and other resources.
What you’ll see and what it does
Welcome to the Home page!
Read on to familiarize yourself with the Security Console Home page and get an introduction to some of the features you’ll use on a regular basis. This article will cover some initial functions, display objects, navigation, and quick links to features, settings, and other resources.
Use the following keyed screenshot to locate each part of the interface along the way.
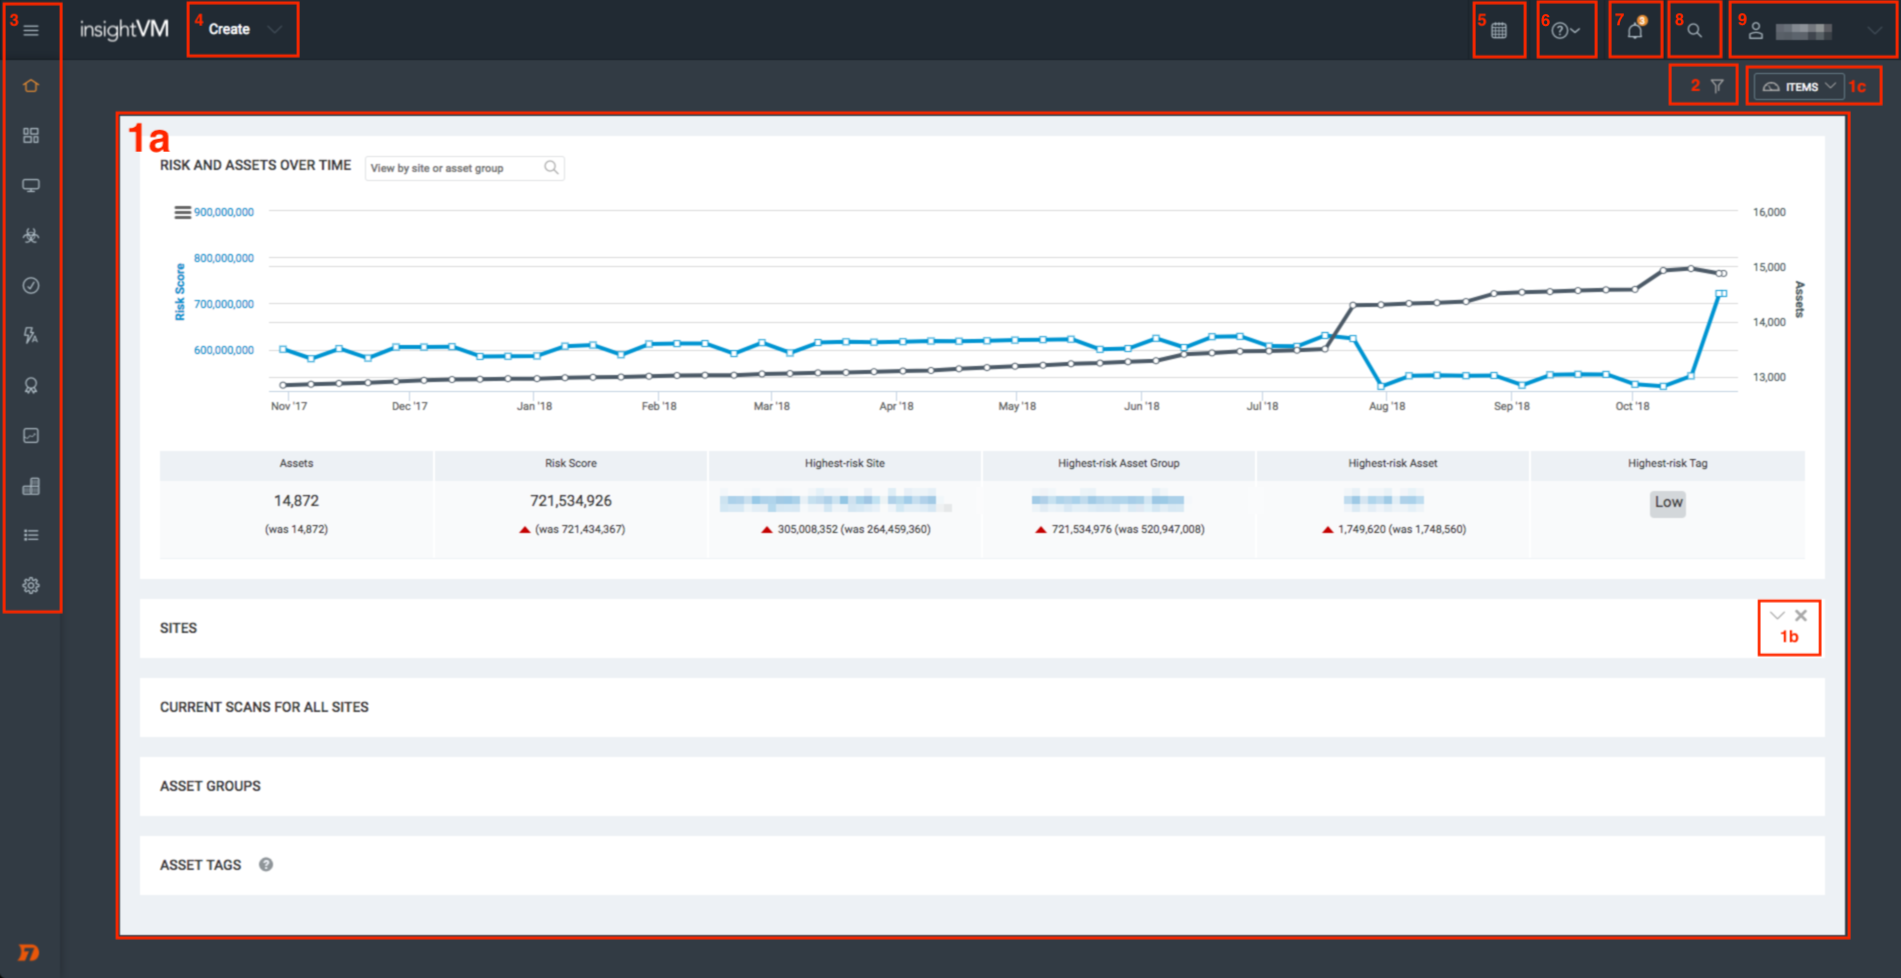
1a. Default Items
The Home page of the Security Console includes several informational panels reflecting the assessment of risk in your environment along with your existing configurations. The data you accumulate and settings you configure during the course of this guide will populate this space later.
These default items include:
- Risk and Assets Over Time - This chart is a combination of two line graphs: one representing your total asset count, and one representing your total assessed risk score. This chart can give you a general idea of how your risk is being managed over time relative to the number of assets in your network.
- Sites - This table shows all the sites you have configured along with their current metrics, status, and quick links to site functions. A site is a collection of assets that are targeted for a scan. You’ll create your first site in the next article of this guide.
- Current Scans for All Sites - This table displays any in-progress scans. You’ll run your first scan after creating your site.
- Asset Groups - Your configured asset groups are shown here. Asset groups are used for monitoring and reporting purposes and are based on the assessment results of your scans.
- Asset Tags - You can tag your assets, sites, and asset groups with several built-in or custom tags to provide additional context in your network as you see fit. All default and configured tags are shown in this table.
1b. Item Collapse, Expand, and Removal Controls
You can collapse, expand, and remove any default item using the item controls shown in this corner of the item panel.
1c. Re-add Removed Items
If you need to re-add removed items back to your Home page, click the Items dropdown shown in the upper right corner of your screen.
2. Filtered Asset Search
Click the filter icon to launch the Filtered Asset Search function. Filtered assets searches are used to organize your scanned assets according to a variety of parameters. You’ll create your first asset group with a filtered asset search later on in this guide.
3. Left Navigation Menu
The left navigation menu contains quick links to program features and settings. Hover your mouse cursor over this area to expand it.
NOTE
Your product license determines which tabs are available to you from this menu.
4. Create Dropdown
The Create dropdown contains quick links for creating some of the most common Security Console objects, including sites, asset groups, reports, and tags. This helpful shortcut will save you from navigating through the web interface for common tasks.
5. Calendar
Click the Calendar icon to view a calendar that shows all your current scan schedules, report schedules, and blackout periods.
6. Help Dropdown
The Help dropdown contains quick links to different kinds of resource material, including product documentation, API documentation, and release notes. The Content Updates option lists all new and modified vulnerability coverage content that was applied to the Security Console within the last seven days.
7. Notification Center
Expand the Notification Center to browse all in-product notifications posted to your Security Console, color-coded by importance. Some notifications may suggest that you take action to address your settings or a condition in your environment and will provide shortcut links to assist you.
8. Search Field
Separate from Filtered Asset Search, use this general search field to find sites, assets, asset groups, tags, vulnerabilities, and Common Configuration Enumerations (CCEs) according to the string value you specify. Use asterisks to wildcard portions of your string to return additional results.
9. User Dropdown
The User dropdown displays your username. Click here to quickly access your user preferences or log out.
Now you know your way around!
You should now have an understanding of where to find menu items and functions in the Security Console. Next, we’ll create your first site and run your first scan.
Install and pair a distributed scan engine
Distributed Scan Engines are separate from the Security Console and are strategically provisioned and located in a way that makes your scanning environment as efficient as possible. If you intend to maintain a production deployment of the Security Console, distributed Scan Engines are an absolute necessity.
Install a scan engine
Launch the product installer to get started. Follow the initial prompts until you reach the component selection and communication direction step.
Select Components
After going through the necessary acknowledgements, you’ll be prompted to select which components you want to install.
Select Scan Engine only. This tells the installer that you intend to deploy a distributed Scan Engine.
Select a Communication Direction
After selecting your components, you’ll be prompted to select a communication direction.
Which communication method should I use?
Deciding how your Scan Engine communicates with the Security Console ultimately depends on the configuration and topology of your network. Production deployments commonly have both Scan Engine types in place in order to accommodate scanning conditions like asset location and the presence of firewalls.
See the Scan Engine Communication Methods Help page for best practices and use case information.
If you select the Engine-to-Console method, you will have the opportunity to configure a reverse pair with your Security Console during the Scan Engine installation. Although you can skip this pairing step if you want to, Rapid7 recommends that you take advantage of this pairing opportunity since the post-install reverse pairing procedure involves more complicated steps.
To configure a reverse pair during a Scan Engine installation:
- You can choose to pair the Scan Engine with the Command Platform (Insight Platform). This is optional and not required to complete pairing with the Security Console.
- Select Yes to pair the Scan Engine with the Security Console.
- When prompted by the install wizard, enter the IP address for the Security Console. Then, proceed with the default settings for Console TCP Port [40815].
- Provide the installer with the Security Console shared secret.
- You can generate a shared secret in the Security Console. On the Administration tab, in the Scans section, click Manage scan engines. In the Generate Scan Engine Shared Secret section, click Generate.
Shared secrets expire after 60 minutes
Multiple Scan Engines can use the same console-generated shared secret for each of their reverse pairing procedures. However, shared secrets are only valid for 60 minutes. If your shared secret expires, you must generate a new one to complete any further reverse pairing procedures.
- Test your connection to ensure that your Security Console and Scan Engine can communicate properly.
- Continue with the rest of the Scan Engine installation.
- When the install wizard completes you will be prompted to start the Scan Engine service. This may take a few minutes for the Scan Engine service to finish loading.
- Linux -
systemctl start nexposeengine.service
- Linux -
- After your Scan Engine finishes installing, proceed directly to the Refresh Your New Scan Engine section of this guide.
Engine name and port values
Once paired, the engine name displays in the console GUI with a random set of characters. To identify your newly paired engine, look for the external IP of the engine. You can rename the engine at any time.
The engine port will show 0 on the Scan Engine Configuration page. This is expected behavior.
If you select the Console-to-Engine method, you’ll need to configure a standard pair with your Security Console after the Scan Engine installation completes. Continue with the rest of the installation at this time. After your Scan Engine finishes installing, proceed to the Pair Your Scan Engine to the Security Console section of this guide.
Pair the scan engine
Ensure the scan engine is running and reachable
Make sure your new Scan Engine is running and reachable (see Firewall requirements ) before proceeding with a post-installation pairing procedure. You must also have admin-level access to your Scan Engine host to complete these pairing procedures.
All new Scan Engines must be paired to the Security Console in order to be usable for scanning. These engine pairing procedures differ based on the method of communication you want to implement.
Consult one of the following pairing procedures for your communication method of choice:
Standard Pair (Console-to-Engine)
In order to configure a console-to-engine pairing, the Security Console must be made aware that a new Scan Engine is available for use and must be provided with instructions on how to reach it. Consequently, the first step of all standard pairing procedures is to add your new Scan Engine to the Security Console.
To add a Scan Engine through the Administration tab:
- Browse to and click on the Administration tab in your left navigation menu.
- In the “Scans” section, click Mange scan engins.
- Click New Engine under Scan Engines.
- On the General tab, name your Scan Engine.
- Enter the IP address of your Scan Engine in the “Address” field.
- Click Save when finished.
Properly added Scan Engines generate a consoles.xml file on the Scan Engine host. You will modify this file in the next step.
Modify consoles.xml
The consoles.xml file generated on your Scan Engine host in the previous step contains an entry for the Security Console that added the Scan Engine. You must enable the console to complete the pairing.
To modify the consoles.xml file for a Linux or Windows host:
- Browse to the
consoles.xmlfile in your Scan Engine directory. By default, this file is located in the following places according to the operating system of your Scan Engine host:- Linux -
/opt/rapid7/nexpose/nse/conf/consoles.xml - Windows -
Files\Rapid7\NeXpose\nse\conf\consoles.xml
- Linux -
- Open
consoles.xmlwith a text editor of your choice. Navigate to the<consoles>element. The Security Console that added the Scan Engine appears as a<console>element with several attributes.- You can identify the correct Security Console by checking that the
lastAddressattribute matches the IP address of the Security Console you want to pair with.
- You can identify the correct Security Console by checking that the
- Change the value for the
enabledattribute from0to1. - Save and close the
consoles.xmlfile. - Restart the Scan Engine host so your changes can take effect.
Reverse Pair (Engine-to-Console)
If you took advantage of the reverse pairing configuration opportunity during your Scan Engine installation, then you’ve already completed this step! Proceed directly to the Refresh Your New Scan Engine section of this guide to verify that your Scan Engine is ready for use.
However, if you installed a Scan Engine with the Engine-to-Console method selected without completing the reverse pairing step, you must complete the pairing with a separate procedure. See the Post-Installation Engine-to-Console Pairing page for instructions on how to do this.
Refresh the scan engine
After completing a standard or reverse pair for your Scan Engine, you must refresh its status to verify that the Security Console can communicate with it properly.
Refresh the engine
- Browse to and click on the Administration tab in your left navigation menu.
- In the “Scans” section, click Manage scan engines.
- In the “Scan Engines” section, click Refresh Displayed Engines. This ensures that your Scan Engine table is up-to-date.
- Locate the distributed Scan Engine that you paired to the Security Console.
- Click the icon in the “Refresh” column to complete the verification process.
Scan engine statuses
If you have properly configured and paired your Scan Engine, it now displays up-to-date version and communication status information. The “Communication Status” column itself indicates both the current communication method by arrow and connection state by color. Arrows pointing to “Engine” indicate a standard pairing, while arrows pointing to “Console” indicate reverse pairing. Additionally, arrow icons can have the following color codes:
- Green - Scan Engine is active
- Orange - Scan Engine status is unknown
- An “unknown” status indicates that the Security Console and the Scan Engine could not communicate even though no error was recorded. This is often the result of a significant lapse between pings. Refresh the Scan Engine status to attempt communication again.
- Red - There are three possibilities associated with this color code:
- Pending Authorization - This state indicates that the Security Console has not yet been enabled on the Scan Engine. Consoles must be enabled on the Scan Engine during the pairing procedure.
- Incompatible - This state indicates that the Security Console and Scan Engine are on different versions. Consoles and engines must be on the same version in order to communicate properly.
- Down - This state indicates that the Scan Engine is offline.
(Optional) Deploy an agent
You can also deploy an Rapid7 Agent (Insight Agent) to centralize and monitor data on the Command Platform (Insight Platform). For more information on this see, Using the Rapid7 Agent (Insight Agent) with Vulnerability Management (InsightVM) or our Rapid7 Agent (Insight Agent) documentation .
Create and scan your first site
Create your first site
- On the Home page of the Security Console, click Create and select Site.
- On the Site Configuration page, set your configuration options:
- Info & Security: Name and describe your site.
- Assets: Enter the name, IP address, or IP range to specify which assets to include in the site.
- To configure your authentication and set credentials: a. Click Authentication>Add credentials>General. Add a name and description. This name helps you easily identify the credentials from the Manage Authentication tab later. b. On the Account tab, select the authentication service you want to use. Enter the username and password. c. On the Add Credentials tab, click the Test Credentials dropdown. Specify the IP address or FQDN of the asset you want to test. Specify the port number for the authentication service. d. Click Test Credentials.
Understanding credential test results
Successful credential tests show a green confirmation message.
Failed tests appear in red and may show the following text:
* Invalid credentials - Your username and/or password were incorrect.
* Connection refused - You specified the wrong port number, the port is not open on the host, or a firewall actively blocked the connection.
* No route to host - The IP address or FQDN specified was not found on the network. This means that you entered the wrong address, the host network cannot be reached from the network subnet hosting the console, or the host is not connected.
e. Click Create to save the credentials.
Complete a full scan of your site
For your first scan, you complete a full scan of your site for all risks. This gives you a baseline understanding of what risks exist. You can run and schedule more specific scans later, but for the purpose of onboarding, you complete a full scan first.
- On the Select Scan Template tab, select Full Audit without Web Spider.
- On the Select Engine tab, select the scan engine.
- Click Save & Scan.
View scan progress
After initiating your first scan, the Security Console displays the site details page. The Scan Progress section at the top gives you a live look at the progress of the ongoing scan as it runs. Upon completion, the Scan Status column displays Completed successfully.
If your scan does not complete successfully, you can review statuses to understand why and troubleshoot why this issue is occuring. See Understanding different scan engine statuses and states for more information.
View scan results
On the same site details page, browse to the Completed Assets section and click the address link for your asset. The scanned asset detail view contains information about your asset, including the type of operating system it’s running, whether it’s a physical or virtual machine, and its calculated risk score. Risk scores help you determine which vulnerabilities pose the most risk to your business so you can prioritize remediation accordingly.
You can also examine each individual vulnerability that was detected on the asset by reviewing the Vulnerabilities table.
Days 16-45: Identify Your Threat Landscape
Now that you have done the fundamental steps for setup it’s a good opportunity to set up some of the core features of InsightVM. You will learn how to set up and use features that will help you to share your findings with your team and stakeholders.
Within days 16-45, you will have:
- Created a set of shared credentials
- Scheduled a scan, so you can regularly check your assets
- Created a report, so you can share findings with key stakeholders
- Customized a dashboard
Generate Shared Credentials
Scanning with credentials allows you to gather information about your network and assets that you could not otherwise access. You can inspect assets for a wider range of vulnerabilities. Using shared credentials can save time if you need to perform authenticated scans on a high number of assets in multiple sites that require the same credentials.
Configuring the account for authentication
Configuring the account involves selecting an authentication method or service and providing all settings that are required for authentication, such as a username and password.
If you do not know what authentication service to select or what credentials to use for that service, consult your network administrator.
- Go to the Account page of the Shared Scan Credentials Configuration panel.
- Select an authentication service or method from the drop-down list.
- Enter all requested information in the appropriate text fields.
- If you want to test the credentials or restrict them see the following two sections. Otherwise, click Save.
Schedule a scan
Depending on your security policies and routines, you may schedule certain scans to run on a monthly basis, such as patch verification checks, or on an annual basis, such as certain compliance checks.
It’s a good practice to run discovery scans and vulnerability checks more often—perhaps every week or two weeks, or even several times a week, depending on the importance or risk level of these assets. It is also recommended to schedule scans to align with patching cycles. You can also schedule scans to avoid periods of high site traffic.
Scheduling a scan
During days 1-15 you would have initiated a scan. You can schedule scans to occur at times that best suit you and your organization. You can schedule them to occur during times of lower site traffic, etc.
-
Click the site’s Edit icon in the Sites table on the Home page.
-
Click the Schedules tab of the Site Configuration.
-
Click Create Schedule. Complete the form as follows:
- Name the schedule.
- Select the Enable check box.
- Select the date and time the schedule should start.
- Select a template for the scheduled scan. See Scheduling scans to run with different templates for more information.
- Select a Scan Engine for the scheduled scan. This allows you to create your schedules in a way that lets you take advantage of what you know about the availability and performance of your Scan Engines at particular times.
- If you want to set a maximum duration, enter a numeral for the number of minutes the scan can run. When the scan reaches the duration limit, it will pause. If you don’t enter a value, the scan will simply run until it completes.
- Select an option for what you want the scan to do after it reaches the duration limit. If you select the option to continue where the scan left off, the paused scan will continue at the next scheduled start time. If you select the option to restart the paused scan from the beginning, the paused scan will stop and then start from the beginning at the next scheduled start time.
- To make it a recurring scan, select an option from the Frequency dropdown. Select Other… for additional customization options.
-
Click Save. The newly scheduled scan appears in the Scan Schedules table, which you can access by clicking Manage Schedules.
Generate Your First Report
You can share the results of any completed scans by generating reports. For this example, you create a Top Remediations with Details report scoped to the scan results of the site you created previously.
The Security Console displays the report configuration screen, which is composed of three clickable tabs for creating new reports, viewing saved reports, and managing existing report templates.
- On the Reports tab in the left navigation menu, click the Create a report tab.
- Give your report a name. Report names often indicate the asset scope and the report template in use so that the report is easily recognizable.
- (Optional) Adjust the time zone that will be stamped on the report by making a selection in the provided dropdown list. By default, the Security Console chooses the time zone according to what is detected on its host machine.
- On the Template > Document tab, browse to and select the Top Remediations with Details report template.
- In File format, make sure PDF is selected. RTF and HTML formats are also available for this report template, but Rapid7 recommends the PDF format for readability and portability.
- In Scope, click Select Scan. A site selection window displays.
- Find the site you created previously and click its corresponding radio button to select it.
- Click Select Scan.
- On the Select Scan window, select the most recent scan for this site and click OK.
- In Frequency, ensure Do not run a recurring report is selected. Recurring reports are a great idea for production scanning environments. That being said, you only need a single report for this exercise.
- Review your report configuration and verify that everything is correct.
- Click Save & Run the Report.
Customized dashboards
Dashboards are specialized, overall views of your network in a customizable, drag-and-drop interface. Choose from several pre-built Rapid7 options or start fresh with your own.
Start from a template
- Click the Dashboard tab in your navigation menu. Click Default dashboard and from the dropdown click see More in the R7 Library.
- Click Add next to your desired template.
- Name your dashboard.
- If desired, adjust the description.
- Click OK.
Start from scratch
- Click the Dashboard tab in your navigation menu. Click Default dashboard and from the dropdown click Create a New Dashboard.
- Name your dashboard.
- If desired, add a description.
- Click OK.
Add cards
- Click the + Add Widget button in the upper-right corner of your dashboard.
- Browse the widget list by selecting a category, or refine by searching for keywords.
- Check the box next to any and all desired cards that you want to add.
- Click Add.
Remove cards
- Click the trash icon on the widget you want to remove.
- Click Delete to confirm.
Organize cards
All dashboard cards are draggable. Click and hold the title bar of any widget to drag it to another position on your dashboard.
For more information on dashboards, see Dashboards .
Days 46-90: Respond to Your Findings
During this stage, you will set up tools that will help you to use Vulnerability Management (InsightVM) more efficiently and organize your assets in a way that suits you.
During days 46-90 days, you will:
- Organize your assets by tagging and grouping them
- Schedule a report to run
- Set up goals and SLAs
- Learn more about the remediation of vulnerabilities
Tag and group assets
You can tag an asset individually on the details page for that asset. You also can tag a site or an asset group, which would apply the tag to all member assets. The tagging workflow is identical, regardless of where you tag an asset:
Add tags
- From the Create dropdown, select Tags. In Asset Tags click Add tags.
- Select a tag type.
- If you select Custom Tag, Location, or Owner, type a new tag name to create a new tag. To add multiple names, type one name, press ENTER, type the next, press ENTER, and repeat as often as desired. If you are creating a new custom tag, select a color in which the tag name will appear. All built-in tags have preset colors.
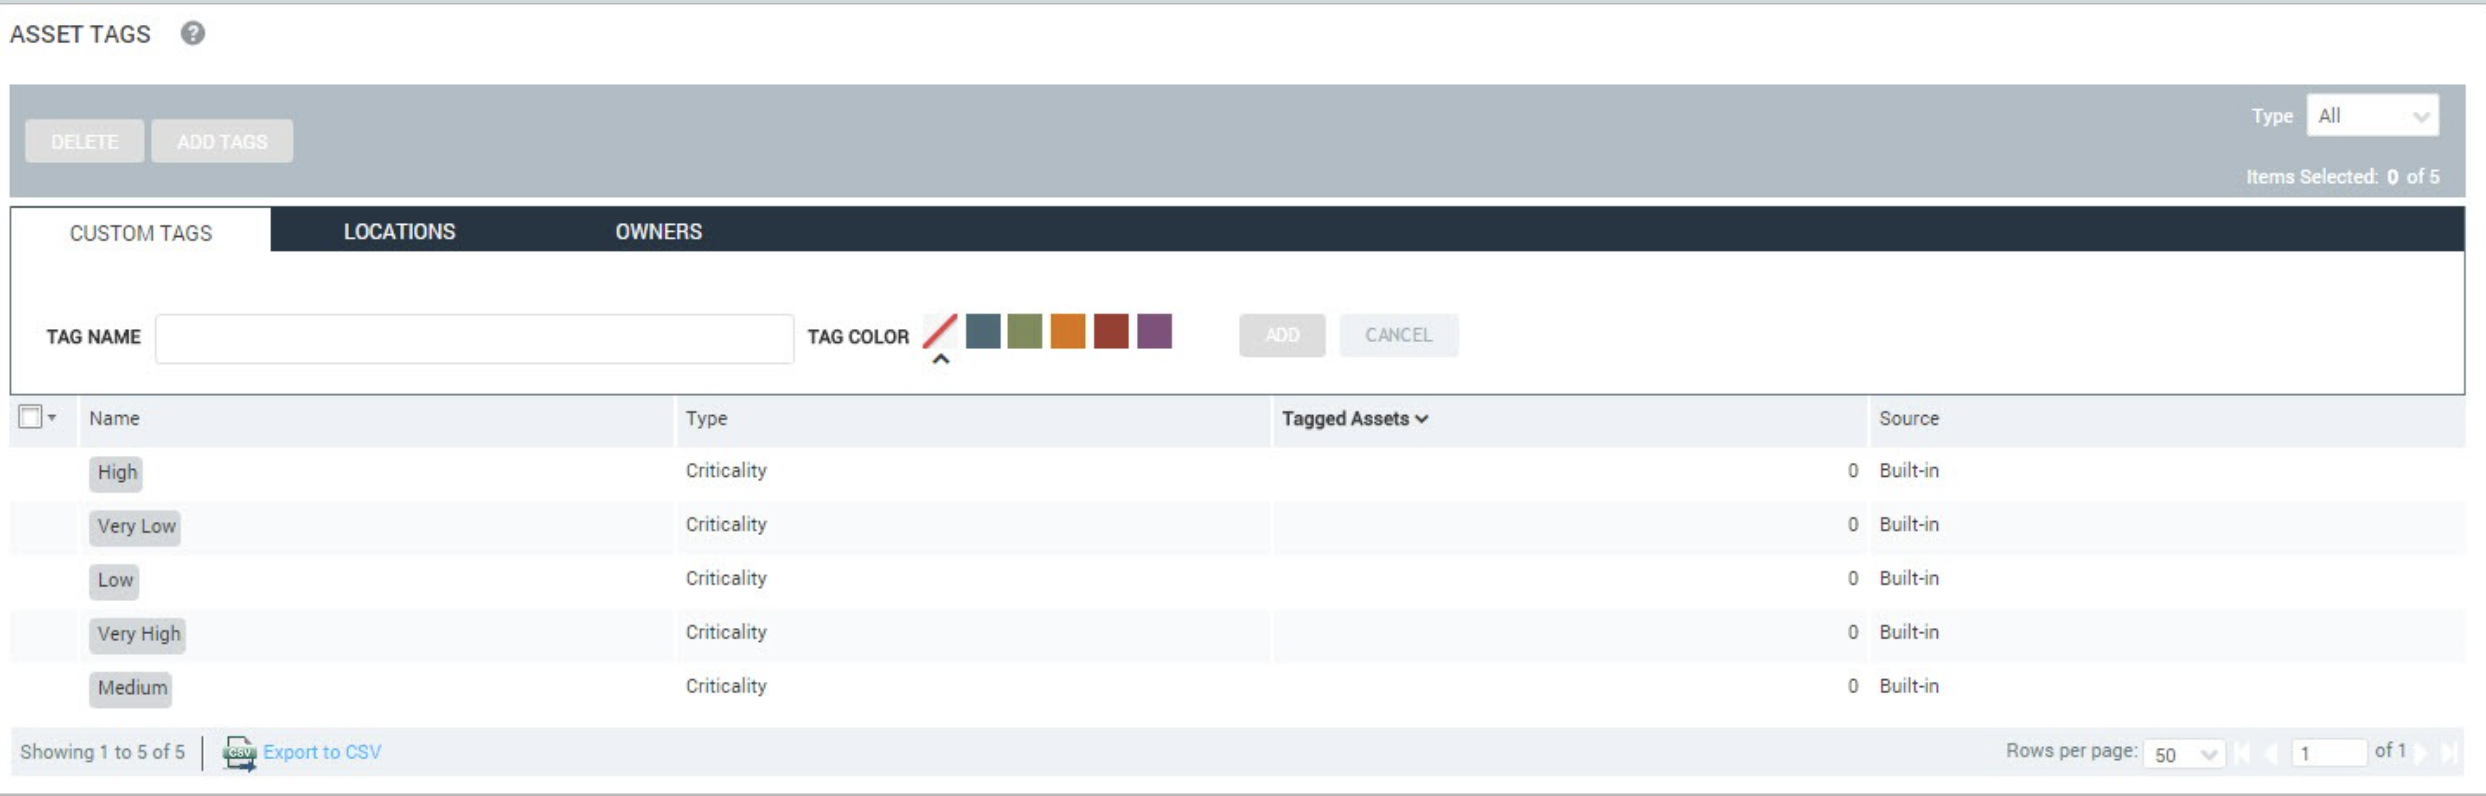
- If you select Criticality, select a criticality level from the list.
- Click Add.
Configure asset groups
Note
You can only create an asset group after running an initial scan of assets that you wish to include in the group.
- Go to the Assets > Asset Groups page.
- At the bottom of the page, click New Static Asset Group to create a new static asset group.
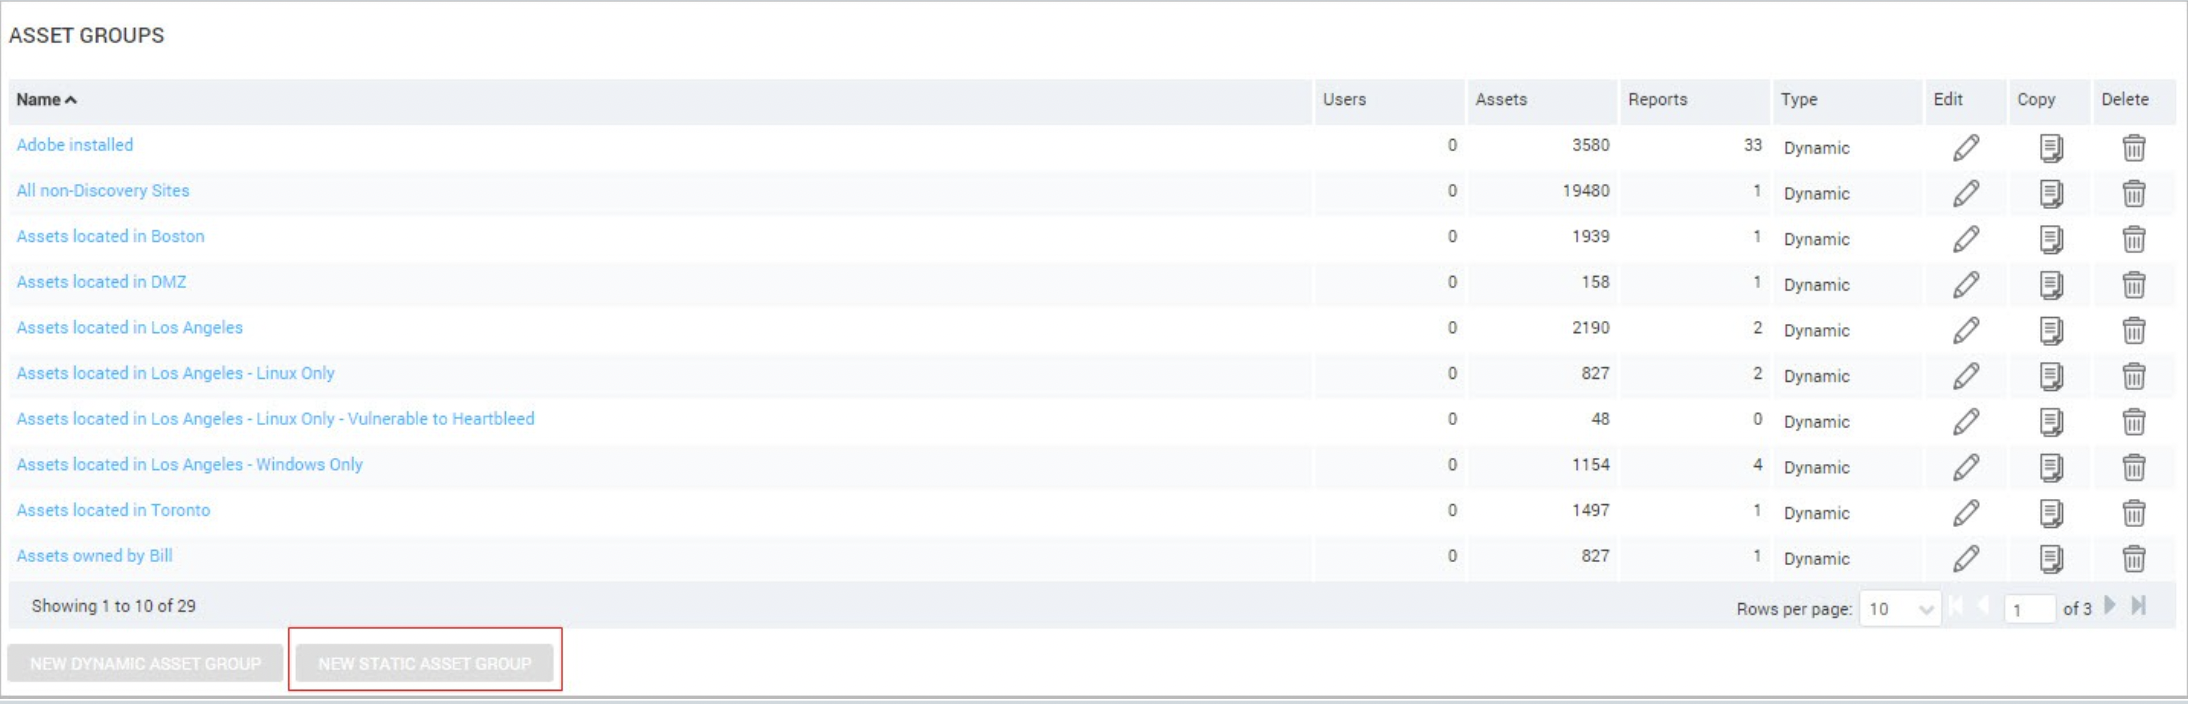
- The console displays the Filtered Asset Search page. Filter the assets you require using the criteria provided in the dropdown. Click Search.
- Click Create Asset Group.
- Ensure the Static radio button is selected. Type a group name and description in the appropriate fields.
- If you want to, add business context tags to the group. Any tag you add to a group will apply to all of the member assets.
- Click Save.
Schedule a report
To schedule this export to automatically occur periodically, you need to use the Report Creation Wizard in Query Builder, which you used to create a report during days 16-45. Recurring reports are a great idea for production scanning environments.
Create a scheduled report
- On the Reports tab in the left navigation menu, click the Create a report tab.
- Give your report a name.
- (Optional) Adjust the time zone that will be stamped on the report by making a selection in the provided dropdown list. By default, the Security Console chooses the time zone according to what is detected on its host machine.
- In Template, select the appropriate template.
- In File format, select the required format.
- In Scope, click Select Scan. A site selection window displays.
- Select the required site.
- Click Select Scan.
- On the Select Scan window, select the most recent scan for this site and click OK.
- In Frequency, select Run a recurring report on a schedule is selected. Select a Start date and time. Select a pattern of recurrence, specifying how many times it should run and whether it should be on a hourly, weekly, monthly basis.
- Review your report configuration and verify that everything is correct.
- Click Save.
Set goals and SLAs
Goals and SLAs is an Vulnerability Management (InsightVM) feature that helps you reduce overall risk and improve the security of your environment. Track your remediation efforts or asset configuration by setting goals and defining metrics to measure against those goals. To view your progress, you can add goal cards to dashboards.
Create a goal from the Goals and SLAs page
- In the left menu, click the Goals and SLAs icon.
- When the Goals and SLAs page appears, click + New Goal in the upper right corner to launch the wizard.
Create a goal from the dashboard
- In the left menu, click the Dashboard icon.
- Click + Add Widget in the upper right corner to launch the wizard to add a goal.
- In the left column, click Goals.
- Select the type of goal you want to create.
- Click Add. This action will add a goal widget on your dashboard.
- On the goal widget, click the dropdown menu and select the goal to display it.
You can also create a goal from scratch. See Create a goal from scratch , for more information.
Remediate Vulnerabilities
A remediation project is a group of solutions for vulnerabilities that need to be remediated on a specific set of assets within a certain time frame.
Remediation projects make it simpler to prioritize, drive, and track remediation progress by showing you the true state of the remediation. Project metrics automatically update as known vulnerabilities are no longer found, so that you can fully visualize the achievements of your remediation teams.
With remediation projects, you can:
- Communicate relevant context and prioritizations to the right people
- Track the progress of remediation projects
- Identify the remediation work that teams are working on at a glance
- Automatically identify, assign, and monitor remediation progress
For more information see:
- Remediation Workflow : This topic contains detailed guidance, a workflow diagram, additional options for using and sharing remediation projects.
- Working with Vulnerabilities : Learn how to analyze vulnerabilities and better understand what should be prioritized for remediation.
- Top 25 Vulnerabilities : Read more on our blog about this report, which identifies your organization’s top 25 vulnerabilities and the assets impacted.
- Collaborating across teams : This blog post provides additional information on how Vulnerability Management (InsightVM) can help your team collaborate on vulnerability remediation.
Days 90+
At this stage, you can build on and customize the key elements of the product we’ve introduced in days 1-90 to scale your security program. For additional support, you can explore our products further, using the following resources.
|Topic|Resources|
|||
|Learn More|The Rapid7 Academy provides training content, webcasts, workshops, certification courses, and other content created by our expert instructors.
We share our research on security issues and trends here
You can refer to our help documentation |
|Stay Up-To-Date|You can stay up to date with what’s going on at Rapid7 by subscribing to our mailing lists . We also regularly post update notifications in-product.
We also have RSS feeds for our blog and release notes .
You can also sign up for product status updates, such as events like degradations, outages, etc. on status.rapid7.com |
|Get Involved|Rapid7 Discuss is an active forum where you can find out more about and discuss Rapid7 products.
Rapid7 Voice is a network of Rapid7 customers, with whom you can share and learn.|
|Contact Support|If you need assistance from our support team, you can contact them here .|