Threat Command Dashboard
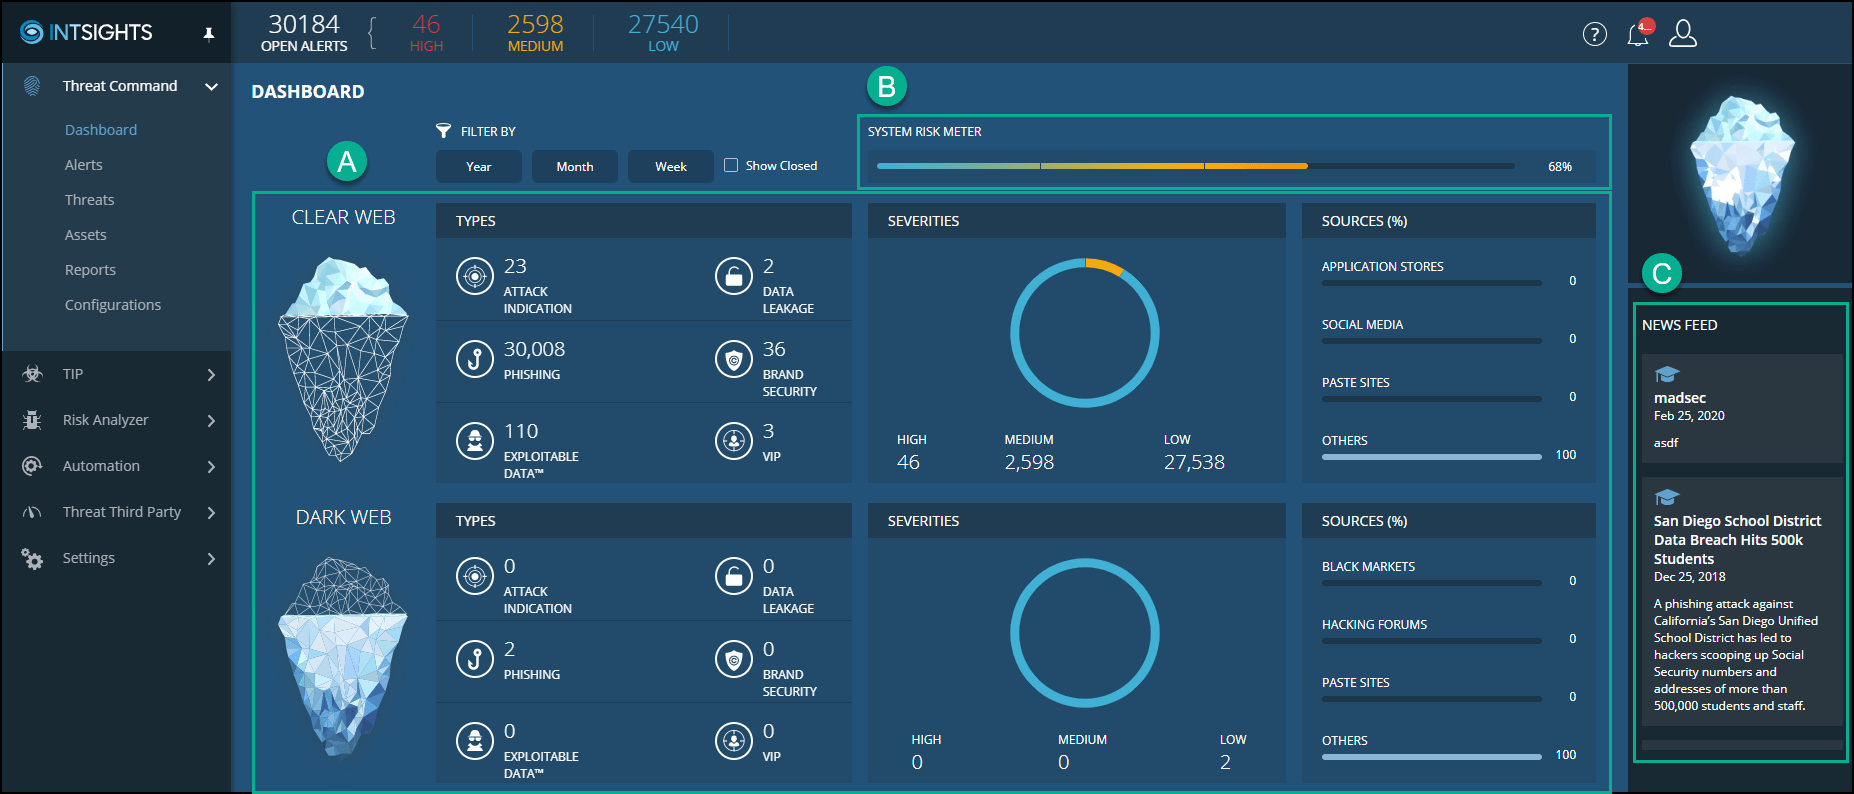
The Threat Command dashboard displays and categorizes threats by type and severity from across the clear, deep, and dark web.
The dashboard shows an overview of the following:
- Alerts, by source type, severity, or type (section A)
- System risk meter that shows the risk level to your organization (section B)
- Newsfeed with a daily update about cyber news (section C)
Threat Command Dashboard
You can click  in the main menu to pin or hide the menu.
To see alerts:
To see the alerts, click an alert heading. The alerts are displayed in the Alerts page, filtered according to your selection
The following demonstrates how clicking a part on the dashboard opens the Alerts page according to those filters.
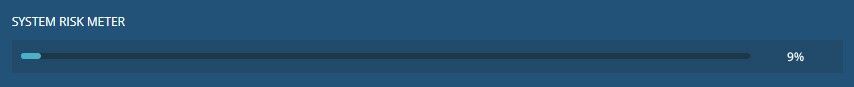
Calculating the risk meter
The risk meter produces an intelligent aggregation of the open and in progress alerts by scoring the previous 30 day's alerts by their amount and severity. The risk formula calculates the risk, from 0 risk to 100% risk.
The following table shows alert severities:
| Severity | Weight |
|---|---|
| High | 6 |
| Medium | 3 |
| Low | 1 |
The formula used to determine the risk is as follows:
Score =
Alert1 +
Alert2 (100-Alert1)/100 +
Alert3 * (100 - (Alert1+(Alert2(100-Alert1)/100)))/100
Example
An account has 3 alerts from the last 30 days: 1 high (Alert1 ), 1 medium (Alert2), and 1 low (Alert3).
The risk score is calculated as follows:
6 +
3 * (100-6)/100 +
1 * (100 - (6+(3*(100-6)/100)))/100
=
6 + 2.82 + 0.91 = 9.73 out of 100