Monitor Your Security Operations Activities
SIEM (InsightIDR) aggregates alert and investigation data across your entire organization and displays it in a single, powerful dashboard so that you can feel confident about your organization’s security posture. The Security Operations Activity dashboard synthesizes your data into actionable insights, making it easier to respond to alerts, report on threat trends, and analyze the overall effectiveness of your security team. Keep reading to learn about the different ways this powerful dashboard can help you successfully monitor your organization’s security operations!
The Security Operations Activity dashboard enables you to:
- Analyze your security team’s investigation activity.
- Understand investigation trends over a selected period of time.
- Determine how quickly investigations are being resolved.
- Review which detection rules are triggered the most.
- Understand which part of the attack chain is the most targeted.
- Determine how often tickets are reopened by detection rule.
Changing the granularity of your data
There are a couple of ways to change the granularity of data that appears on your Security Operations Activity dashboard. You can select a time range from the date picker at the top of the dashboard, which updates the scope of the data displayed in each widget based on your selection. Additionally, some widgets allow you to further change the granularity of the data by day, week, month, or quarter. Here are a few things to note about how date and time details are displayed:
- All date and time details are processed using the UTC time zone.
- View By Day: Starts at midnight each day.
- View by Week: Starts at midnight Monday each week.
- View by Month: Starts at midnight the first day of each calendar month.
- View by Quarter: Starts at midnight the first day of each calendar quarter.
Analyze investigation activity
With SIEM (InsightIDR), you can gain visibility into your security team’s performance and the overall threat trends facing your organization during a specified time range.
Analyze your team’s investigation activity
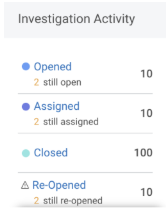
The Investigation Activity widget lets you see which activities have been opened, assigned, closed, and reopened during a selected time range. For overall team performance, it is important to show accumulated activities of each type and how many are still in those states today. Ideally, there will be 0 investigations for each type (still open, still assigned, still re-opened) when viewing the results for “Today”.
Understand investigation activity trends over time
The Investigation Activity Trends widget provides a visual representation of notable trends in your team’s investigations. You can determine whether the alert volume during a selected time frame is within the expectations set by your organization. You can view trends by analyst, detection rule, attack chain, and month. We also calculate the percentage of increase or decrease in closed investigations during the specified time range.
Healthy security team trends look like all 3 lines follow each other closely. Each opened investigation should be quickly assigned and closed as soon as possible. As you broaden the date granularity from the “View by Day” dropdown, counts from each line should get closer to each other.
Determine whether investigations are resolving more quickly over time
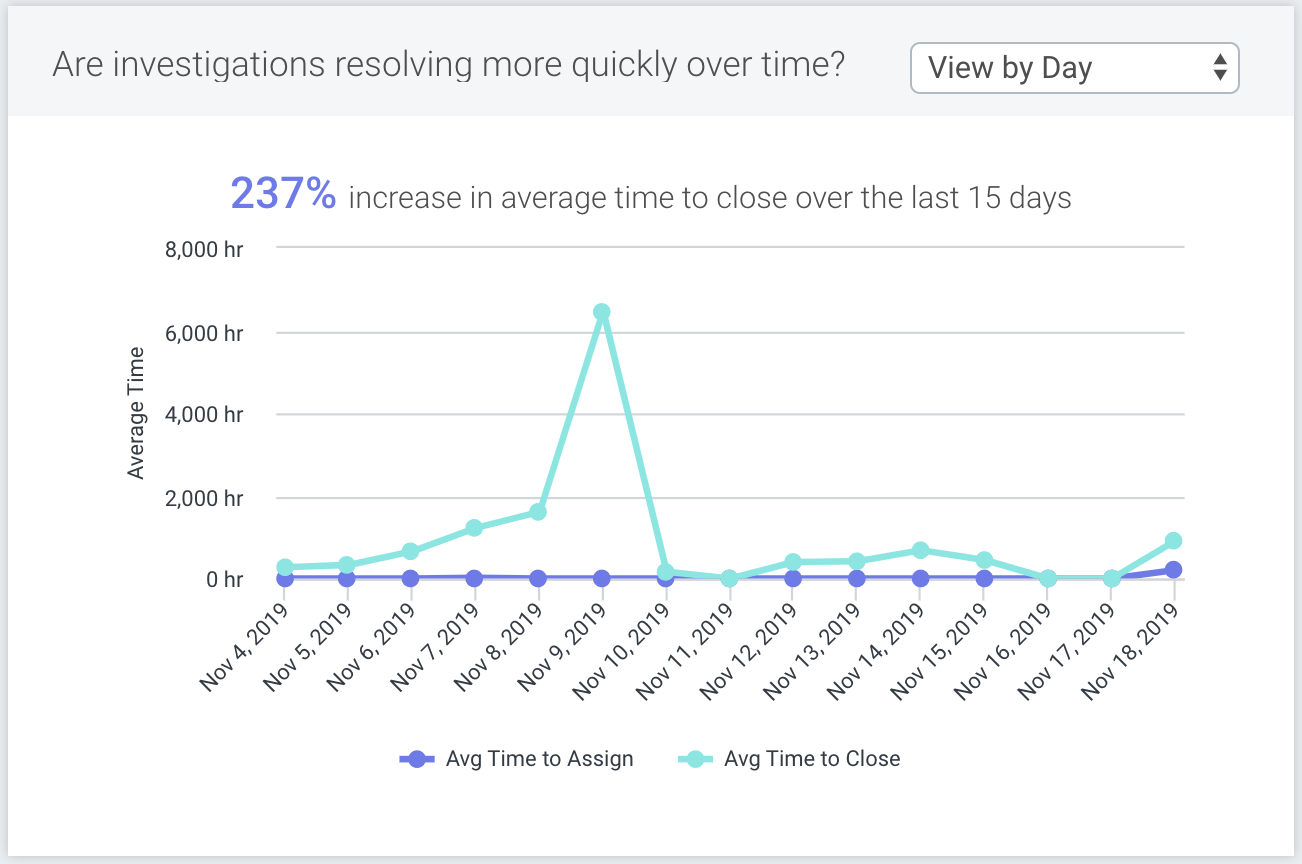
The following widget calculates the average time to close investigations, providing you with clear visibility into the efficiency of your team’s response to threats.
Handling investigations takes time. When a security team is running at peak performance, the Average Time to Close over time should be a flat or near-level trend. The Average Time to Assign should be non-zero. Analyst investigation assignment should be encouraged by the team.
Understand how quickly investigations are being resolved by detection rule
The How quickly are investigations for the top 10 detection rules resolved? widget helps you to understand the efficiency of your security team’s response across multiple detection rules so you can identify areas for improvement. This widget calculates both the average time to assign and the average time to close a ticket across the top ten detection rules. You can change the scope of the data that displays on the widget by selecting a specific time range.
How does top 10 work for this widget?
As there are two sorting options available in this widget, SIEM (InsightIDR) identifies the top 10 detection rules with the highest average time to close, and performs sorting within those 10 detection rules. In other words, sorting by “Average Time to Assign” and “Average Time to Close” is always completed within the top 10 detection rules from “Average Time to Close”.
Use the Average for All Detection Rules as the general barometer for all detection rules to compare to. As you monitor your organization’s activity, you may find that certain trends warrant closer scrutiny. For example, if the Average Time to Close for a single detection rule is higher than the Average for All Detection Rules, it could indicate a lack of familiarity handling investigations of this type or that certain security team procedures, like promptly closing investigations, are being neglected.
Review Attack Trends
To better understand incoming attack vectors, SIEM (InsightIDR) breaks down the detection rules into categories so that you can identify attack trends and their overall impact to your organization.
Determine which detection rules are triggered the most
SIEM (InsightIDR) provides visibility into the detection rules that are generating the most activity, so that you can quickly understand the riskiest event sources on your network.
The Which detection rules are trigged most? widget displays the top 10 detection rules opened within the selected time period. The Trend sparkline visualization for each detection rule shows inbound threat behavior.
Understand the most targeted parts of the attack chain
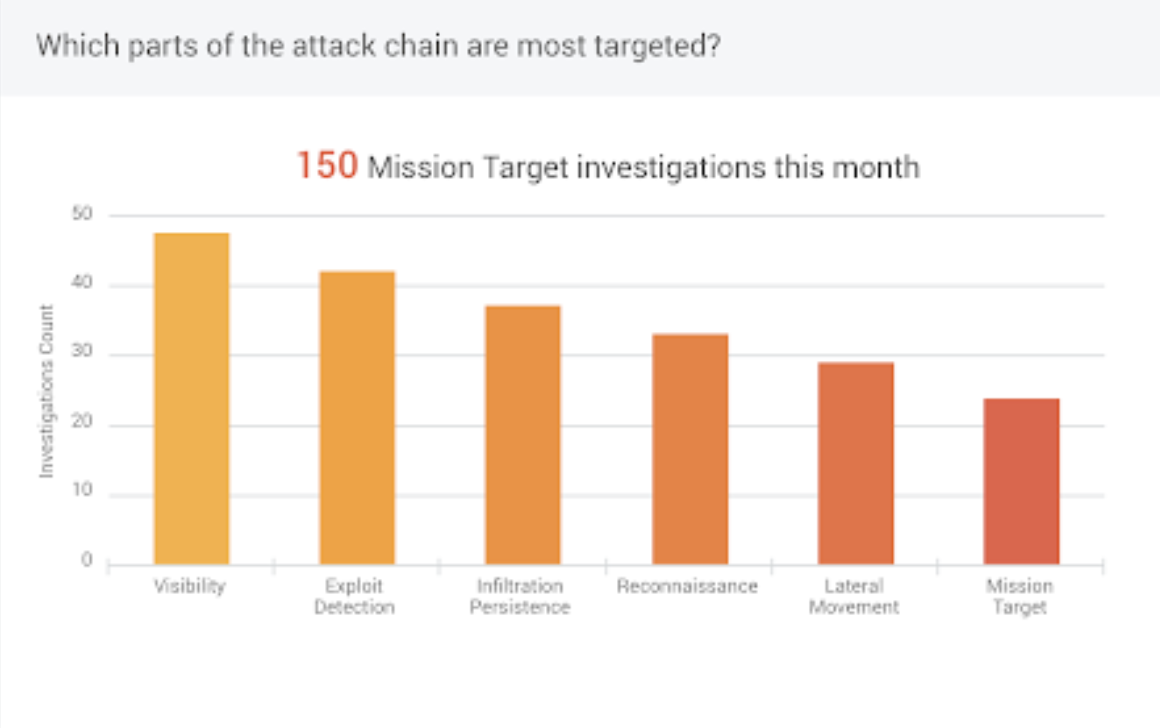
Understanding the most targeted parts of the Attack Chain is useful when analyzing your organization’s current security infrastructure. Ideally, there should be very few investigations of the Mission Target type. If there is a large number of Mission Target investigations compared to other Attack Chain types, it is worth looking into the causes of those investigations or alerts and addressing those potential vulnerabilities.
The following widget allows you to easily identify the most targeted areas in your organization during a specified time range.
Improving Analyst Efficiency
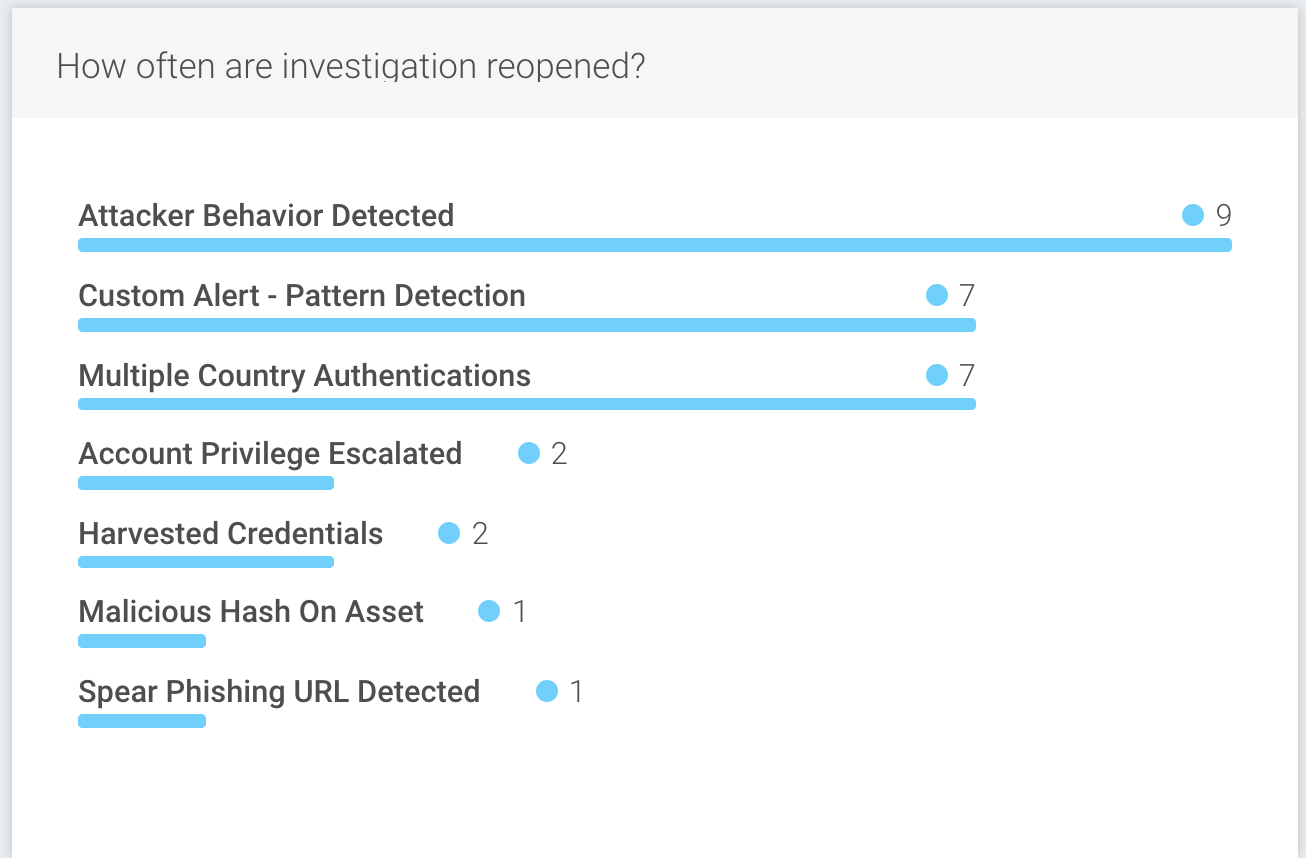
The Security Operations Activity dashboard displays the number of investigations that were reopened across each detection rule over a selected period of time, providing you with visibility into the efficiency of your team and potential areas for improvement.
Reopened investigations mean that the resolution performed was done incorrectly at the time of closing. This type of error indicates inefficient security operation and should be minimized.