Monitor Event Source Health
You can monitor incoming and parsed data for an event source to determine the overall health of your data and easily identify, troubleshoot, and resolve issues.
SIEM (InsightIDR) displays data for incoming and parsed data received in the last day, week, two weeks, or month. For a more granular view of data and parsing rates, use the date picker to adjust the time range.
How to Access Event Source Health Data
- From the Data Collection page, select the Data Collection Health tab. You can do so by completing either of the following:
- From the SIEM (InsightIDR) left menu, select Data Collection.
- From the top right navigation menu, click the Data Collection icon and select Data Collection Health from the drop-down menu.
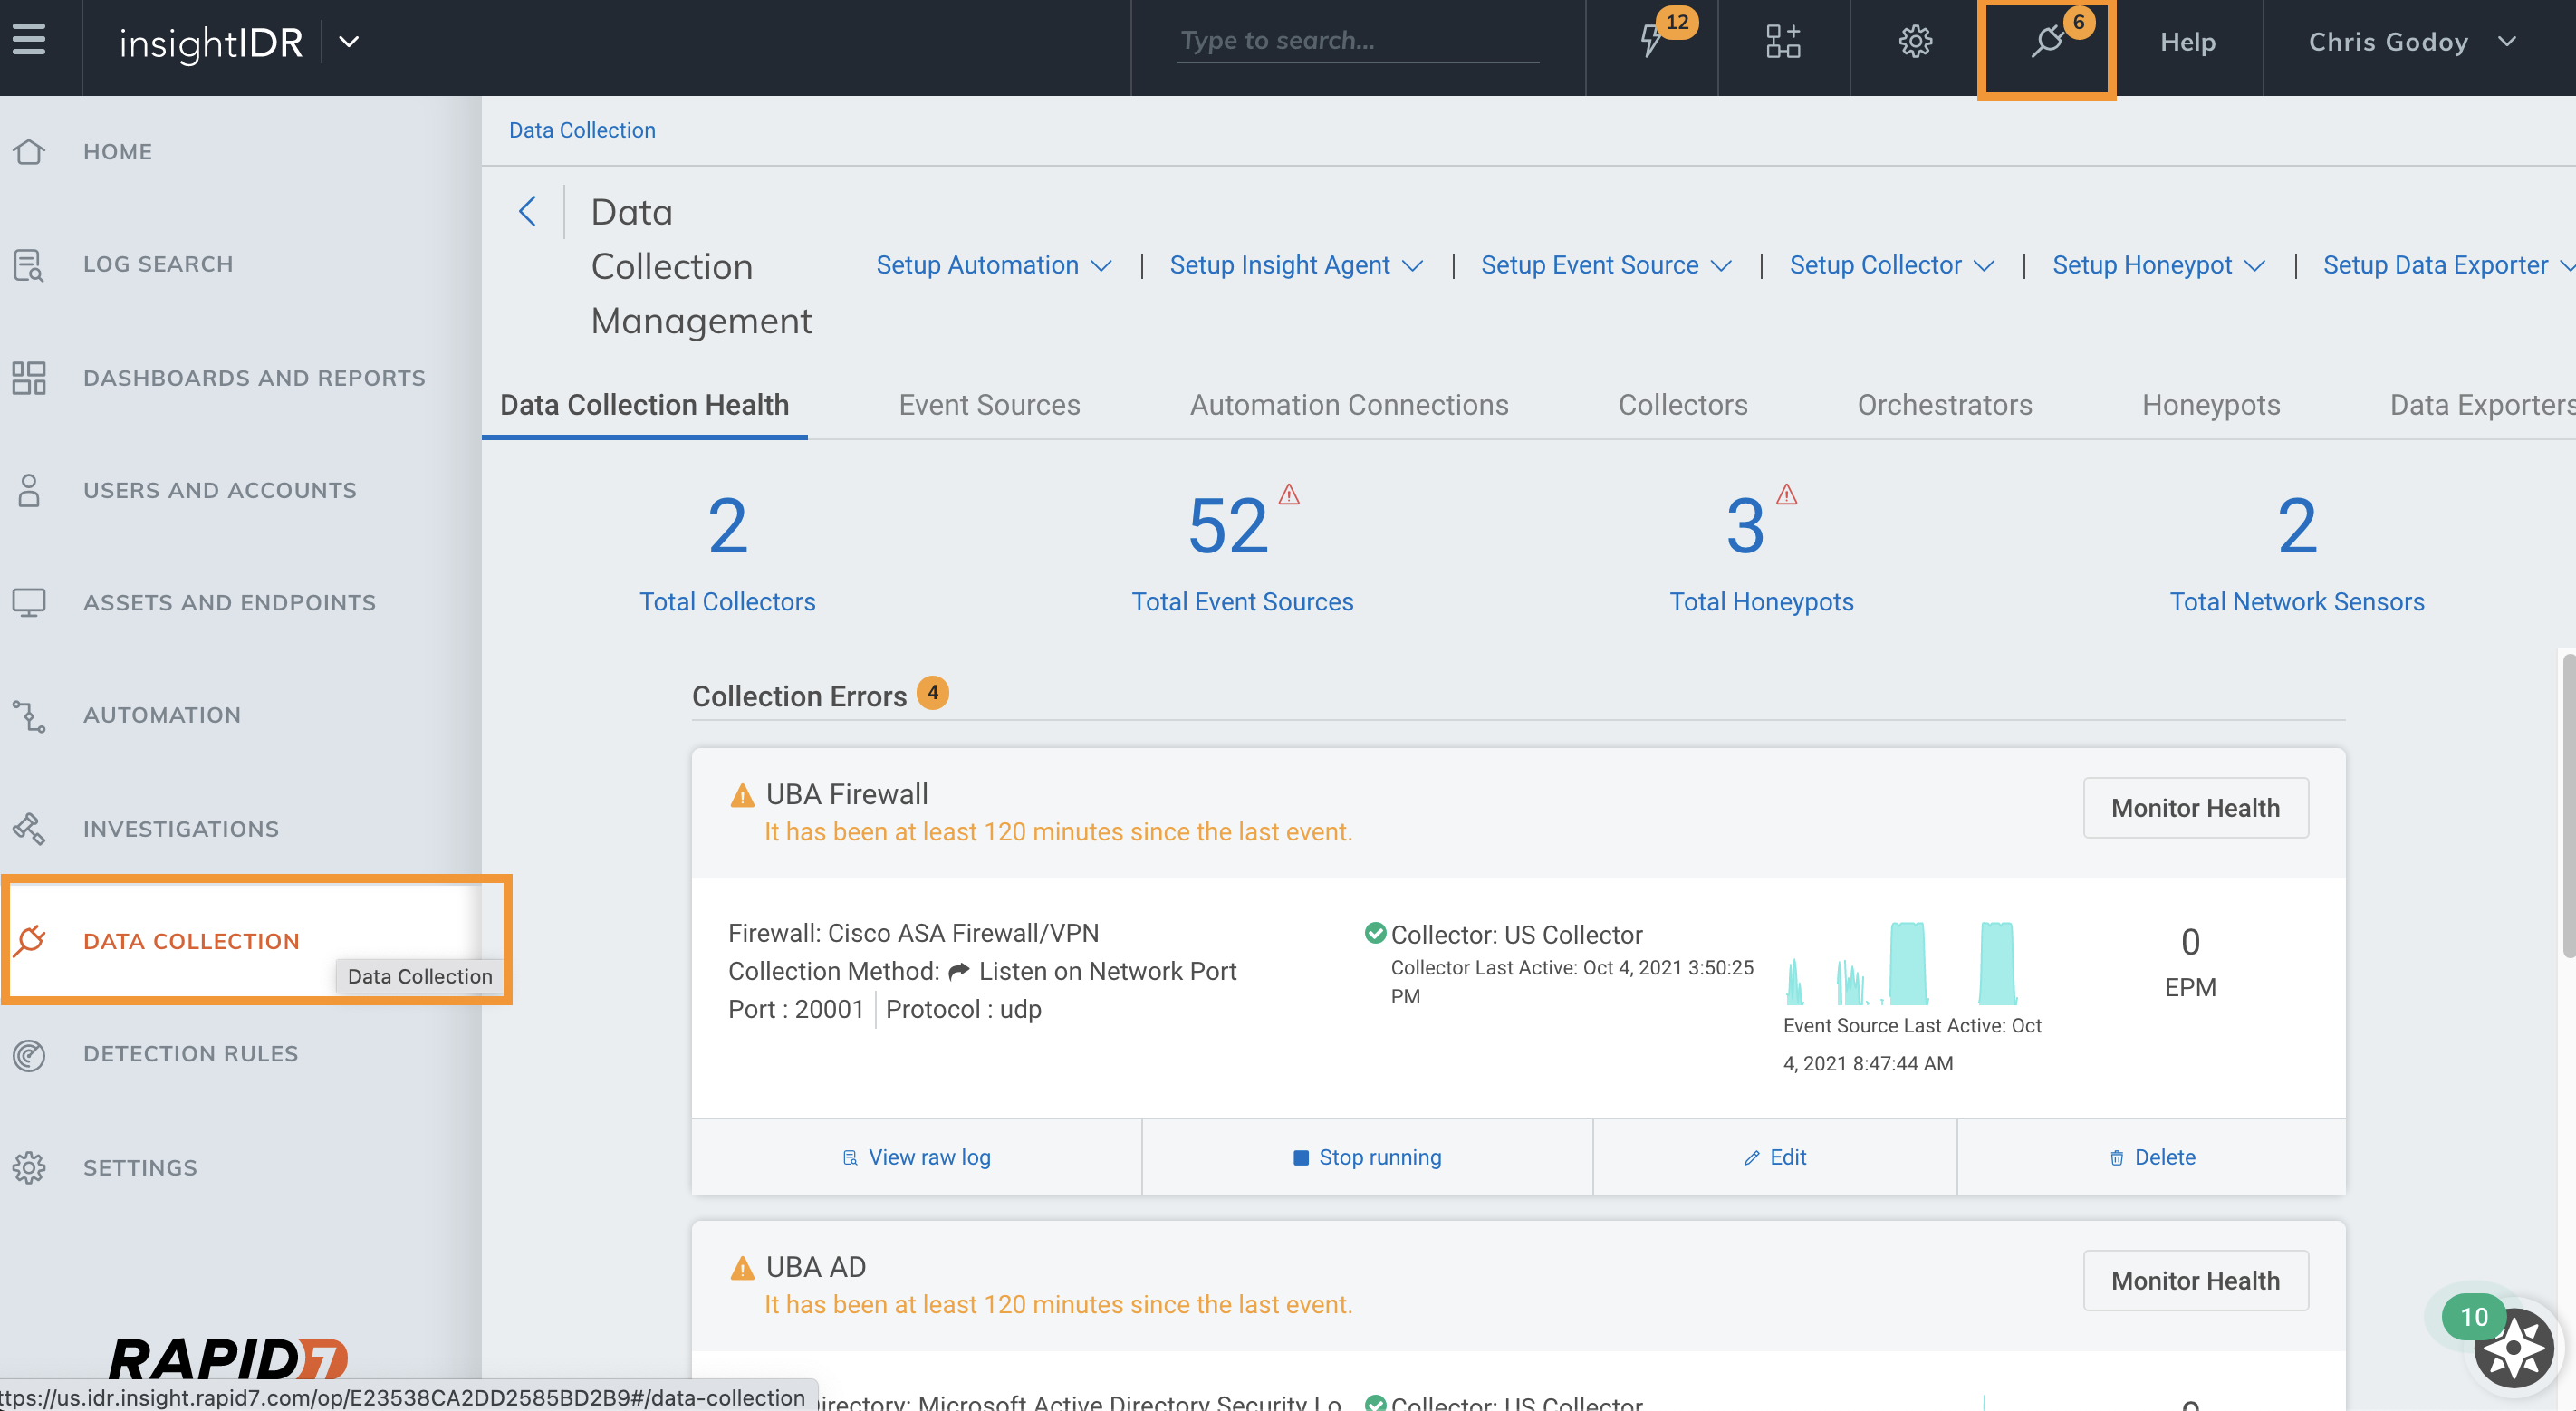
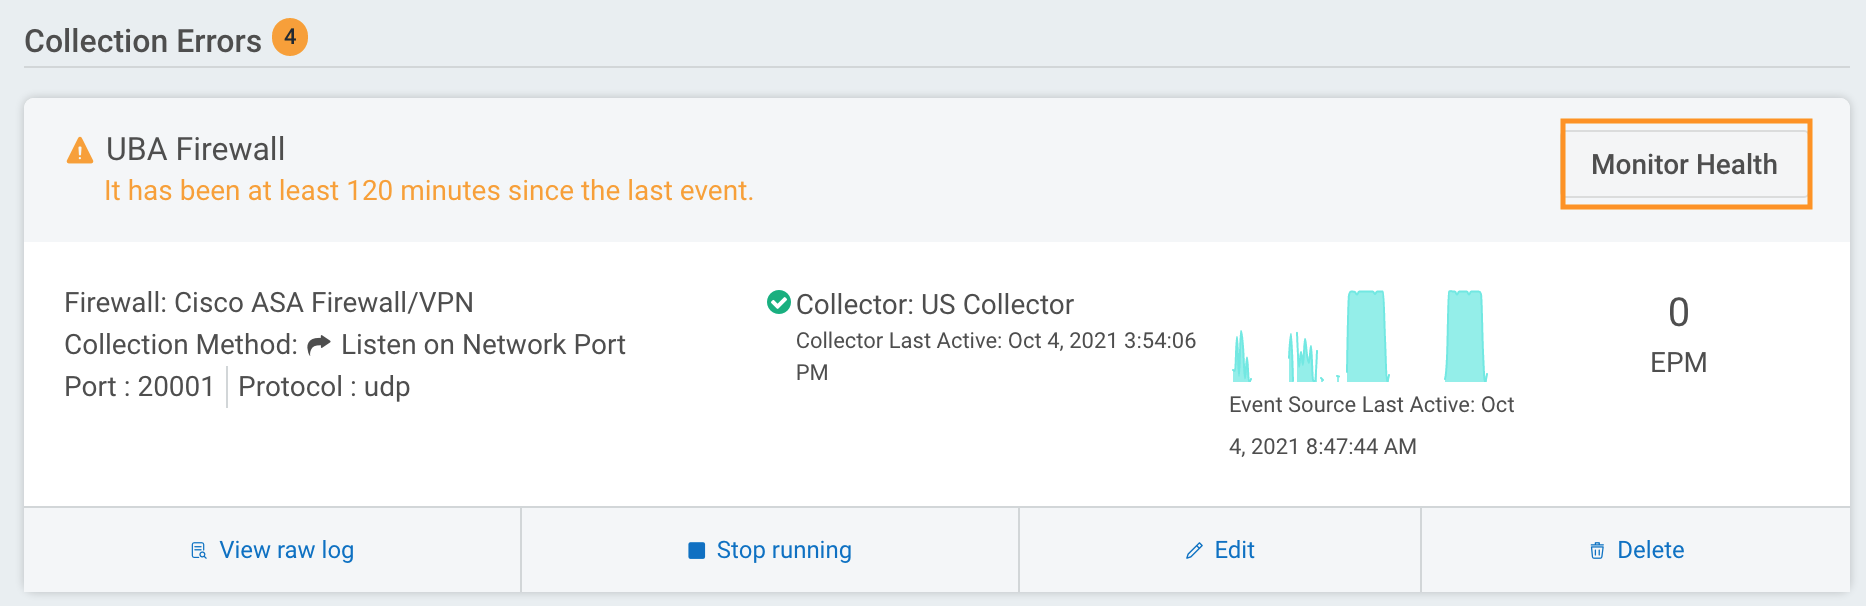
- Review the event sources you have configured and see if any are experiencing collection errors.
- In the top right corner of each event source card, click Monitor Health to more closely review whether logs are successfully being imported and parsed.
Not seeing incoming or parsed data?
For information about expected and unexpected reasons why you might not be seeing incoming or parsed data, visit the Event Source Troubleshooting page.
Monitor your incoming data
The Incoming Data section provides you with visibility into how events are received and sent from the collector to the platform. You can view the number of events received per minute and review data transmission rates to determine internet bandwidth usage for an event source.
You can also view the compressed data sent by the collector to the platform as well as a breakdown of events (and their size) that have been sent to Log Search for an event source.
Monitor your parsed data
The visualizations in the Parsed Data sections are intended to help you determine whether your data is being successfully parsed. You can view a breakdown of the percentage of parsed versus unparsed within a selected timeframe, what type of data of your event source is getting parsed, and a comparison of parsed events by data type within selected time, where you can easy find anomalies in the behaviour of your data.